
← Back to Results
US Nas 100
Buy
• Entry Criteria Not Met
• Updated 5 months ago
Description
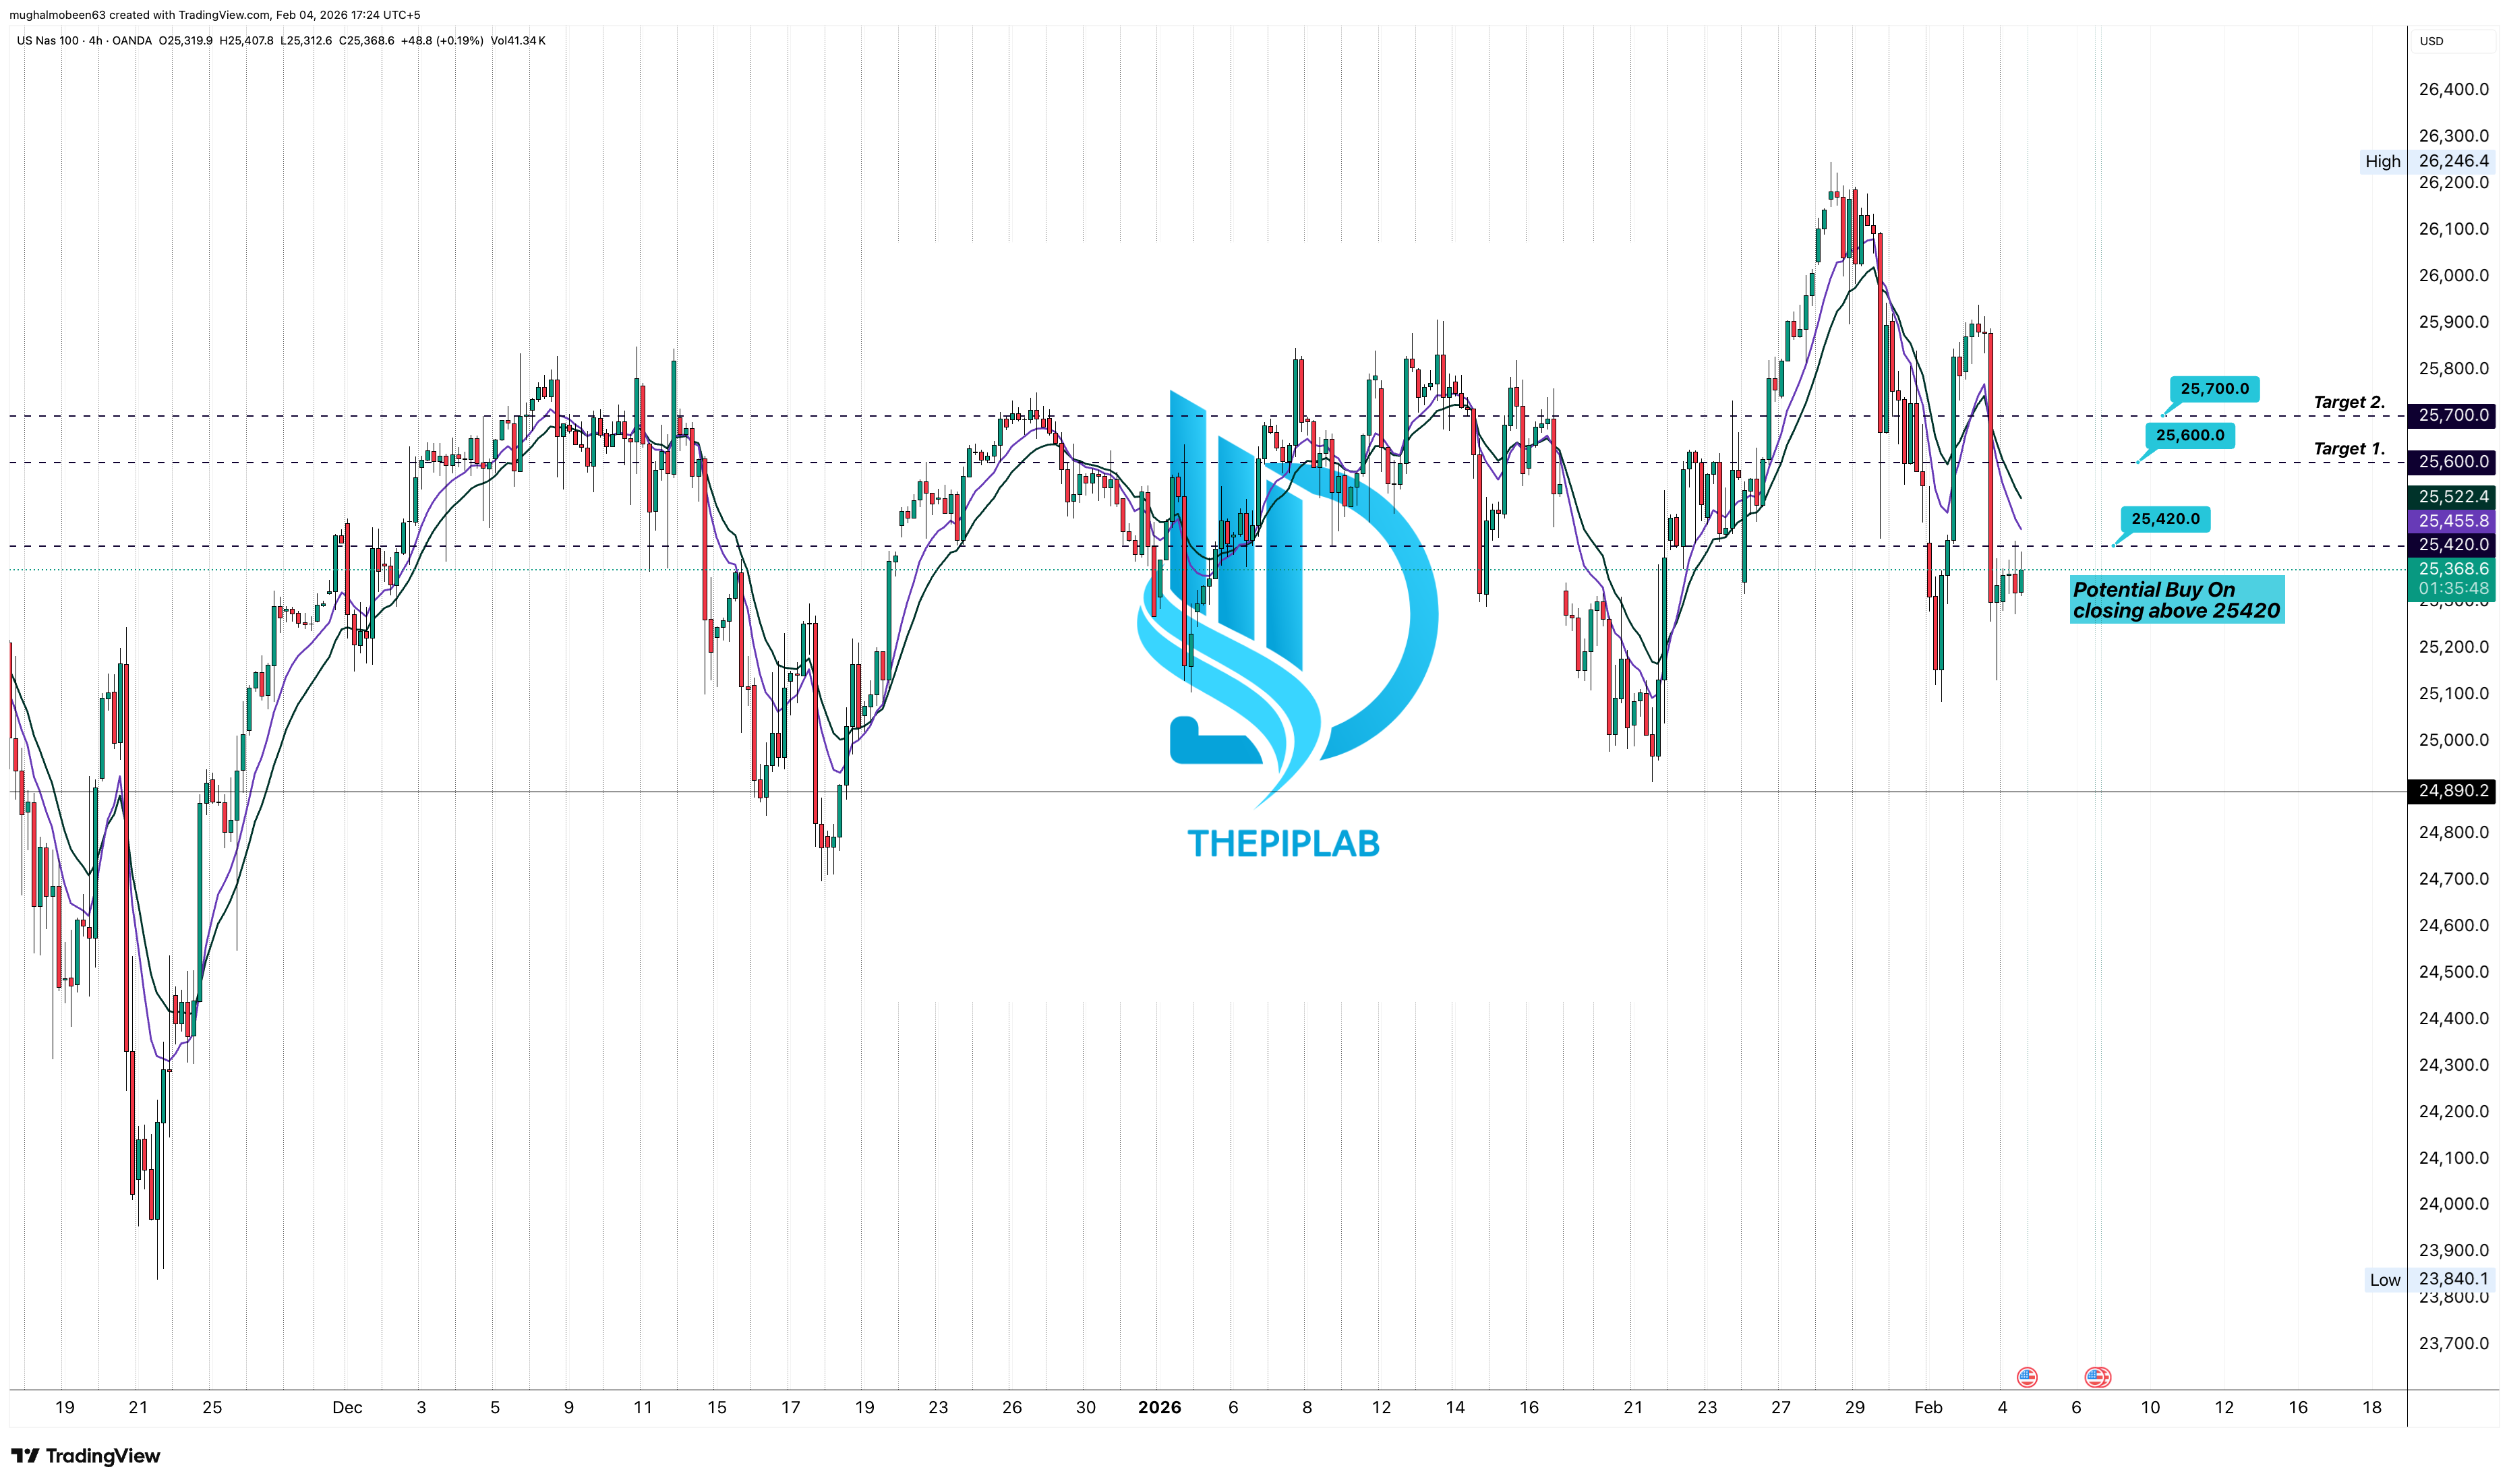
NAS100 is currently consolidating above an important structural level following a corrective pullback within a broader bullish trend. Historical market behavior shows that approximately 65–70% of the time, when price holds above a reclaimed intraday support after a correction, the index continues toward higher liquidity zones.
The current structure suggests that selling pressure has weakened, while buyers are gradually regaining control. Similar setups in NAS100 have frequently resulted in upside continuation once price establishes acceptance above the key decision area.
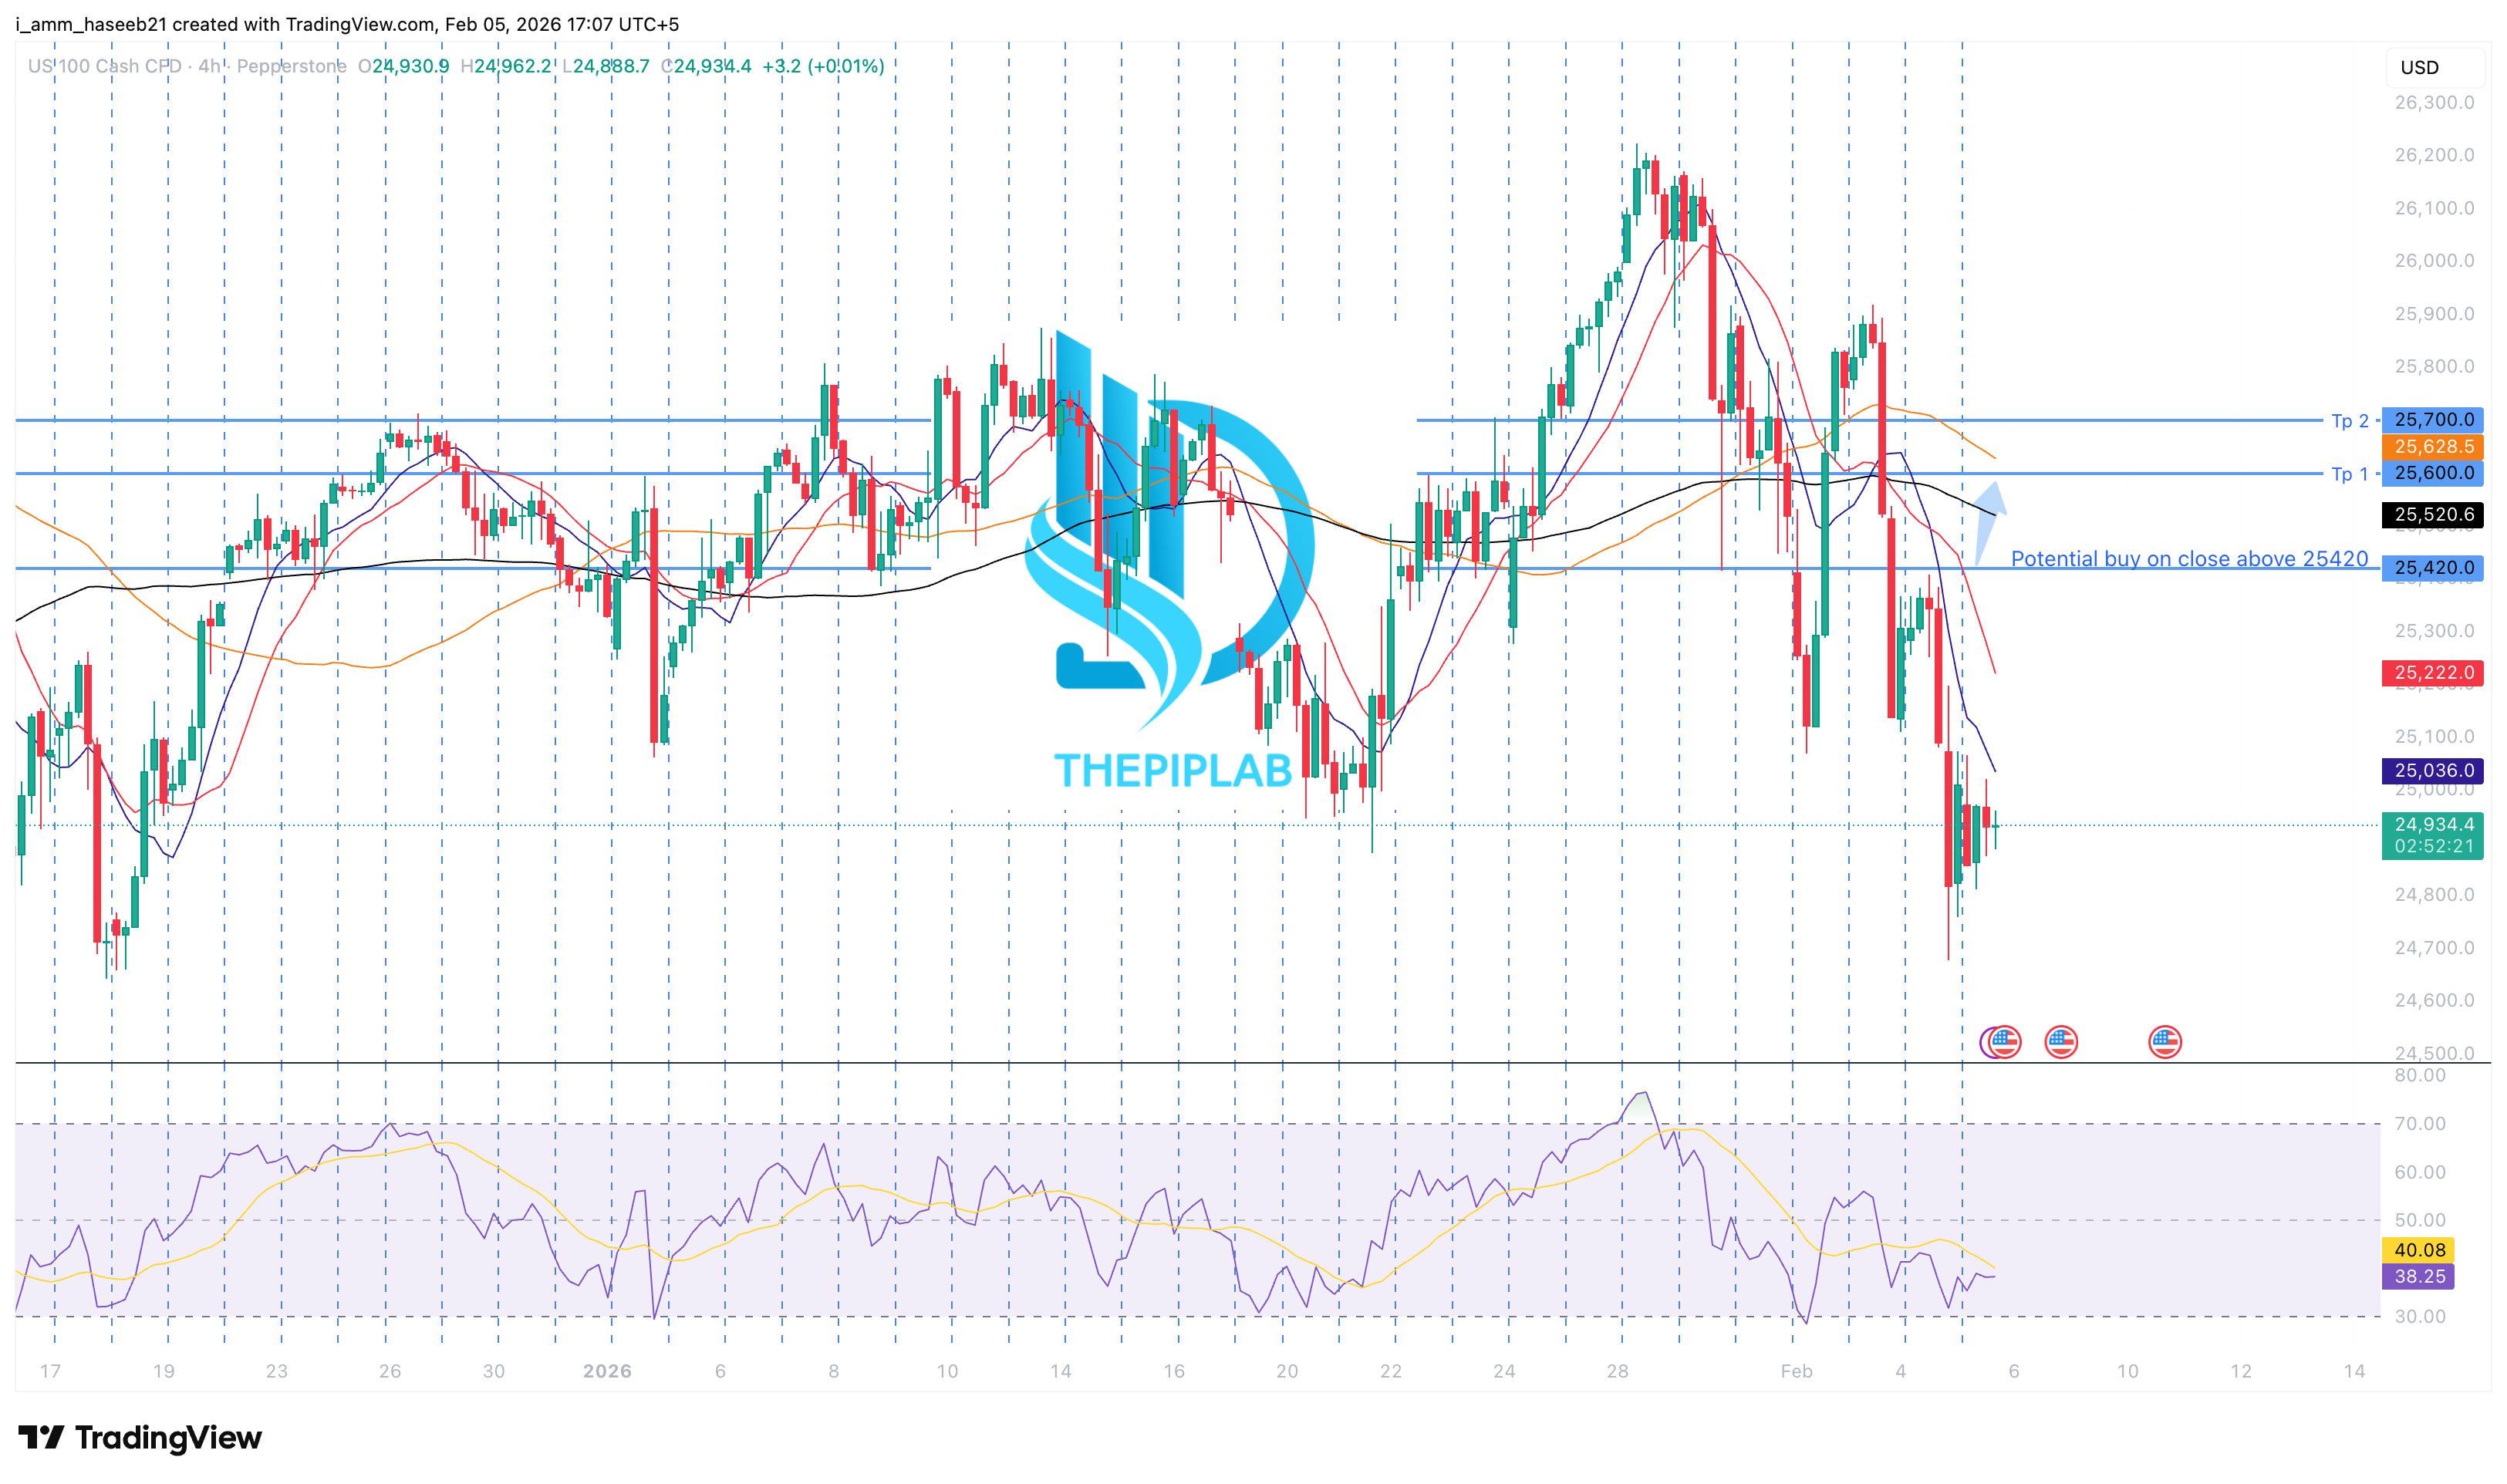
If the current structure remains intact and price sustains above 25,420, the market may gradually progress toward the upper resistance zones over time.
This analysis reflects probability-based behavior derived from historical patterns, not certainty, and short-term fluctuations remain part of normal market dynamics.
The current structure suggests that selling pressure has weakened, while buyers are gradually regaining control. Similar setups in NAS100 have frequently resulted in upside continuation once price establishes acceptance above the key decision area.
If the current structure remains intact and price sustains above 25,420, the market may gradually progress toward the upper resistance zones over time.
This analysis reflects probability-based behavior derived from historical patterns, not certainty, and short-term fluctuations remain part of normal market dynamics.