
← Back to Results
WTI
Buy
• SL Hit
• Updated 4 months ago
Description
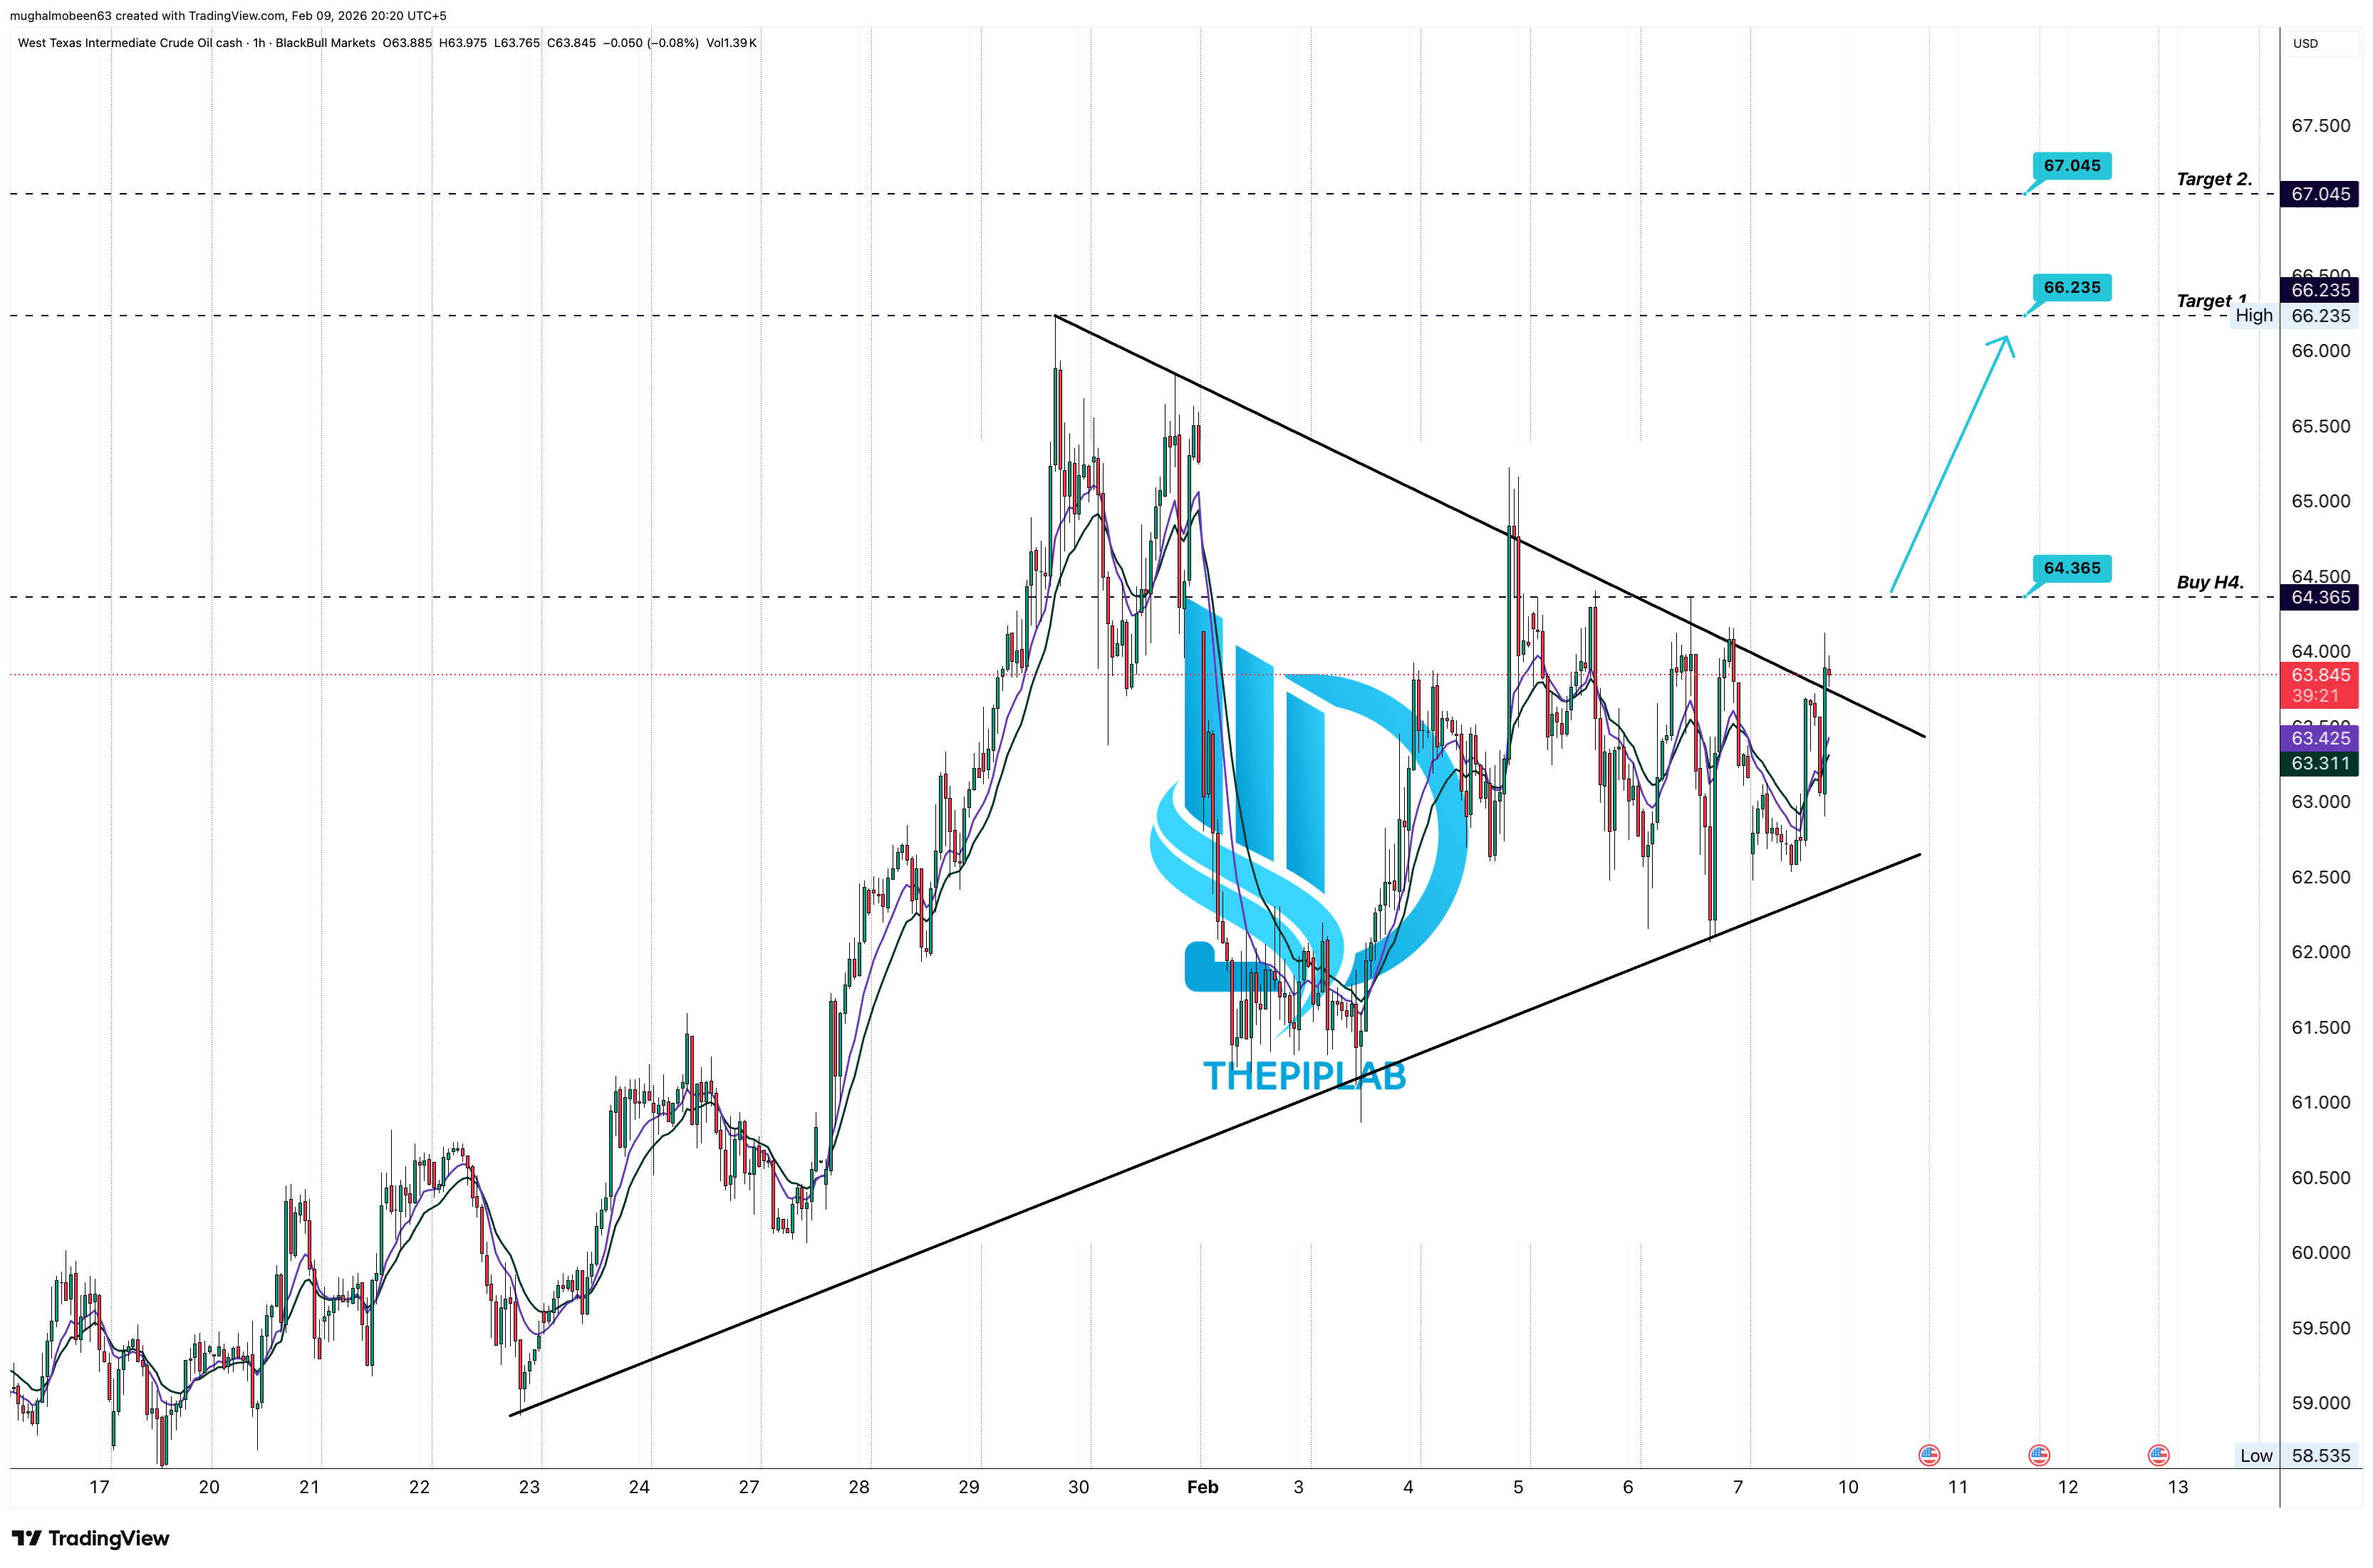
WTI Crude Oil is currently trading within a well-defined compression structure, characterized by higher lows and descending resistance. Historical data shows that approximately 65–70% of the time, when price consolidates in this manner after a bullish impulse, a breakout tends to occur in the direction of the prevailing trend.
Momentum indicators suggest stabilization after prior volatility, while price action shows increasing buying interest near structural support. The repeated defense of higher lows indicates reduced selling pressure and gradual accumulation by buyers.
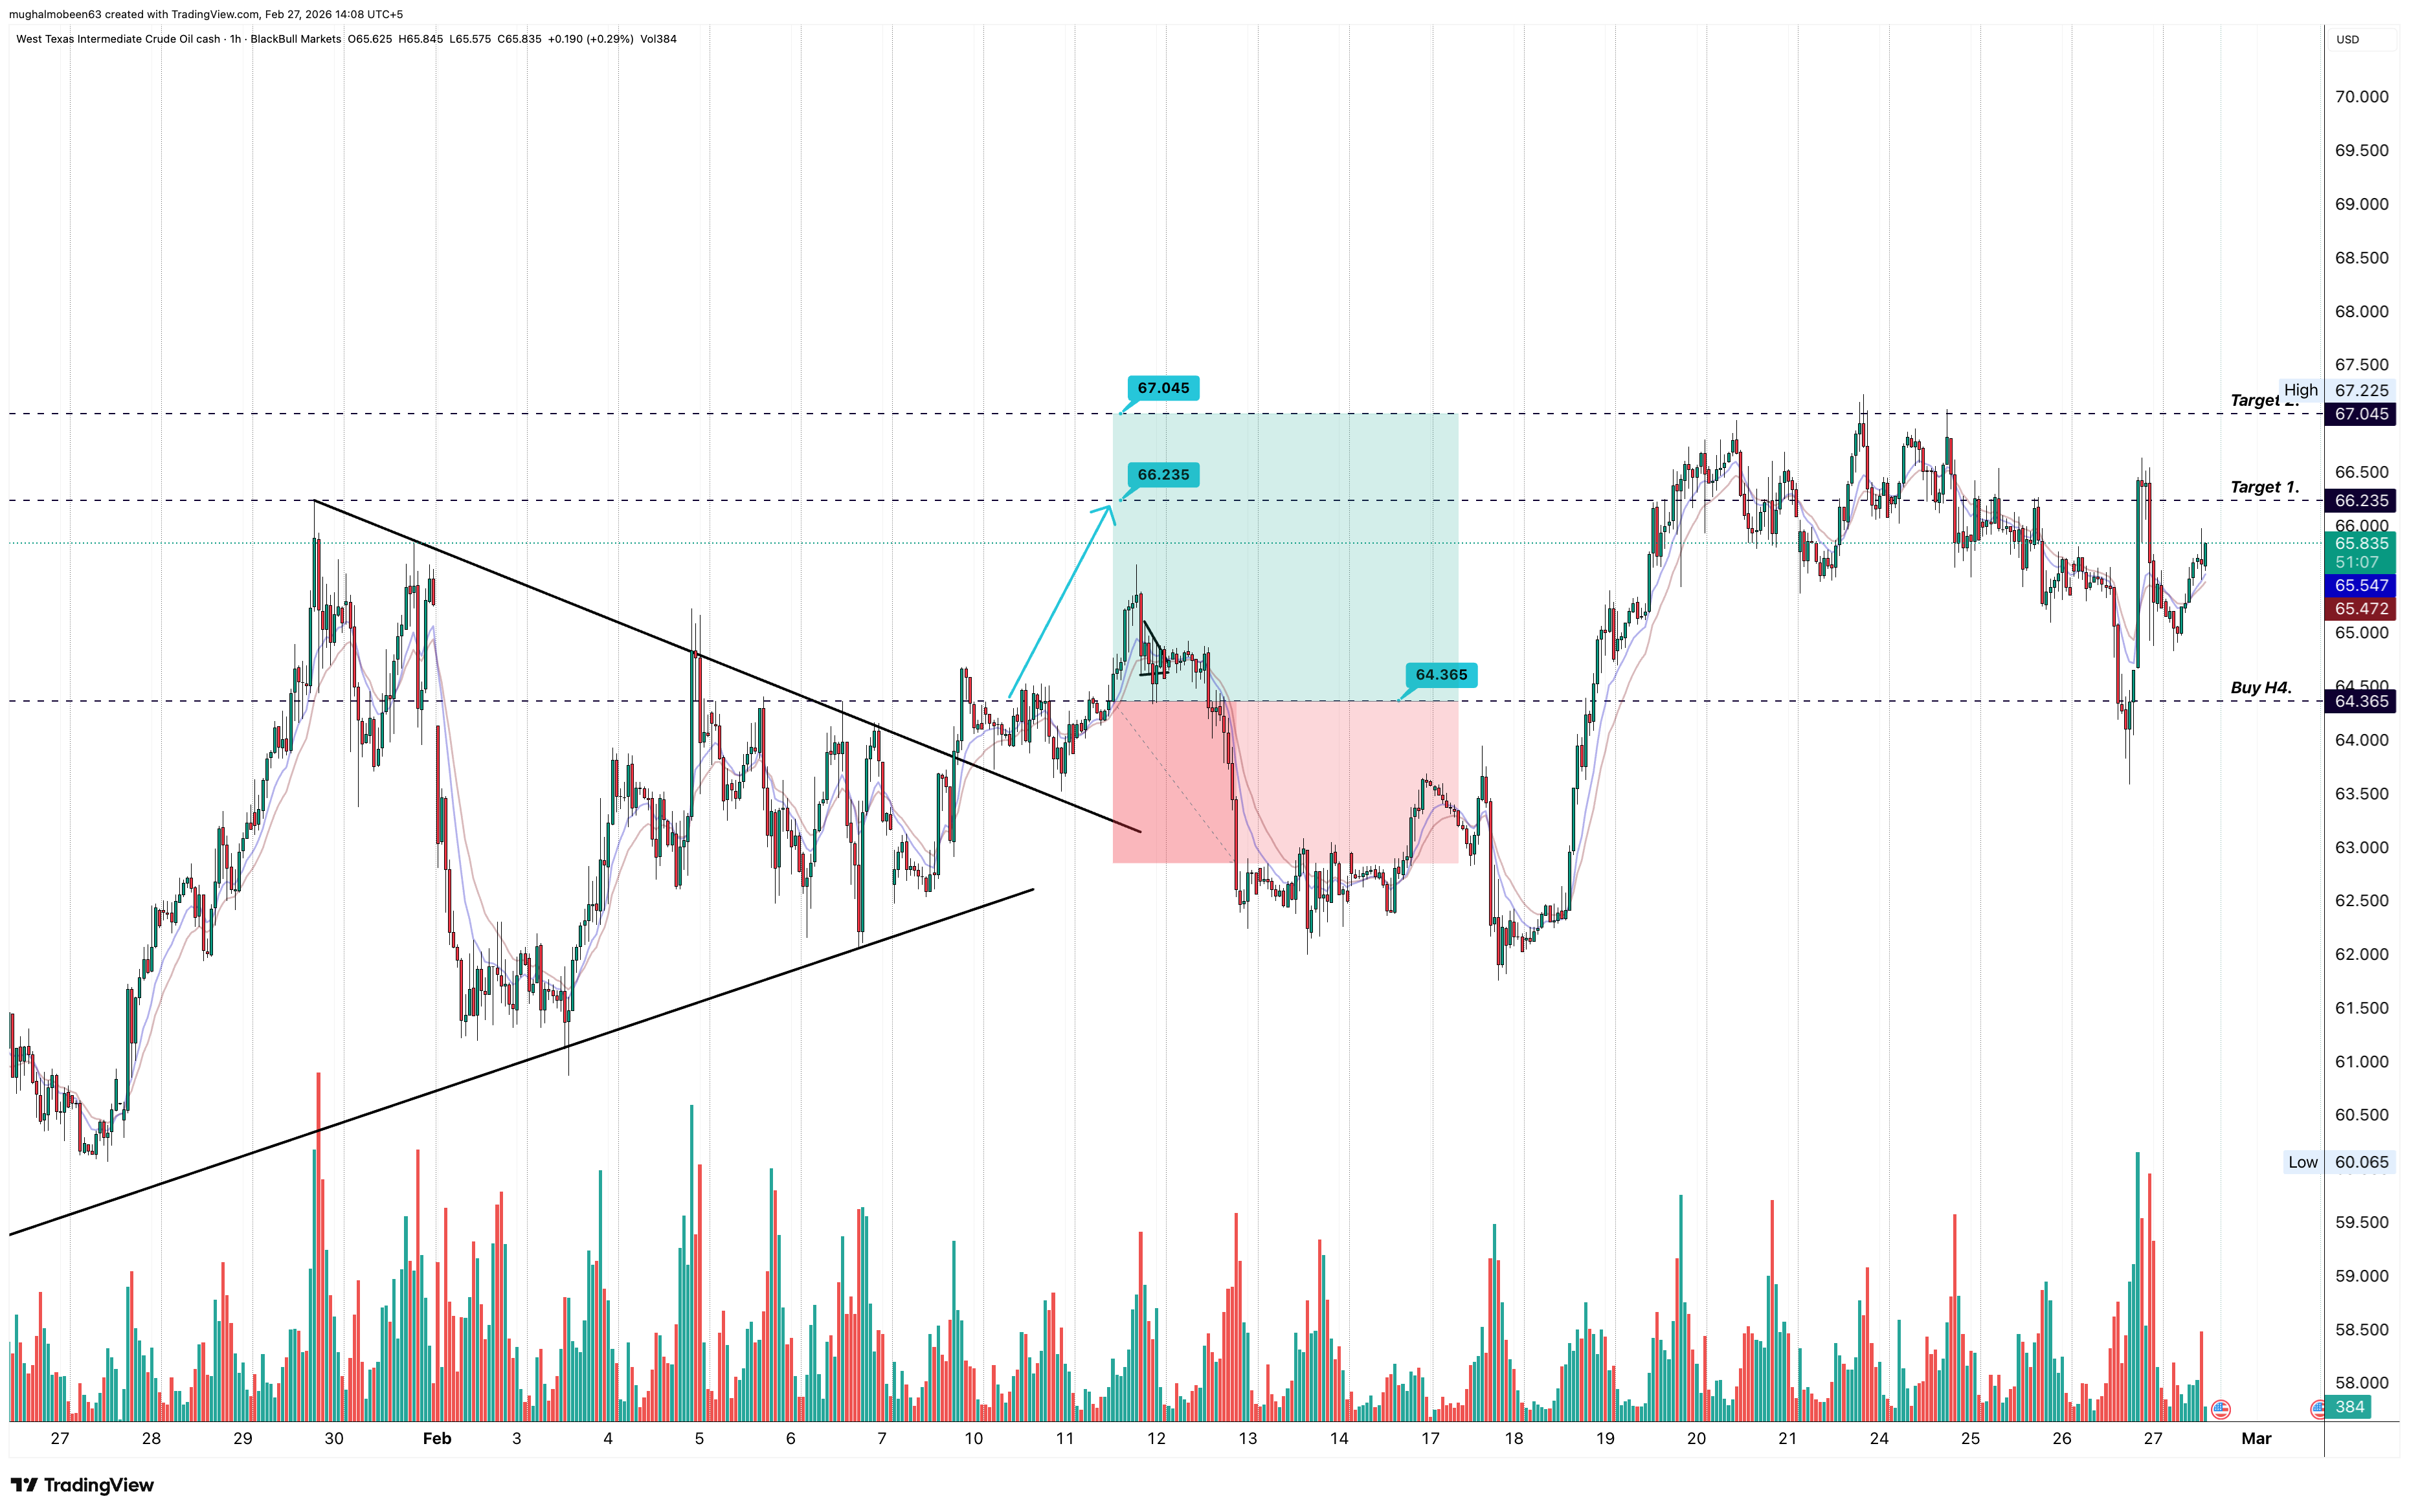
If price maintains acceptance above 64.365, the probability favors an upside continuation toward higher resistance zones over time.
This analysis reflects probability-based behavior derived from historical patterns rather than certainty, and short-term pullbacks remain part of normal market dynamics.
Momentum indicators suggest stabilization after prior volatility, while price action shows increasing buying interest near structural support. The repeated defense of higher lows indicates reduced selling pressure and gradual accumulation by buyers.
If price maintains acceptance above 64.365, the probability favors an upside continuation toward higher resistance zones over time.
This analysis reflects probability-based behavior derived from historical patterns rather than certainty, and short-term pullbacks remain part of normal market dynamics.