
← Back to Results
XAUUSD
Buy
• TP Hit
• Updated 5 months ago
Description
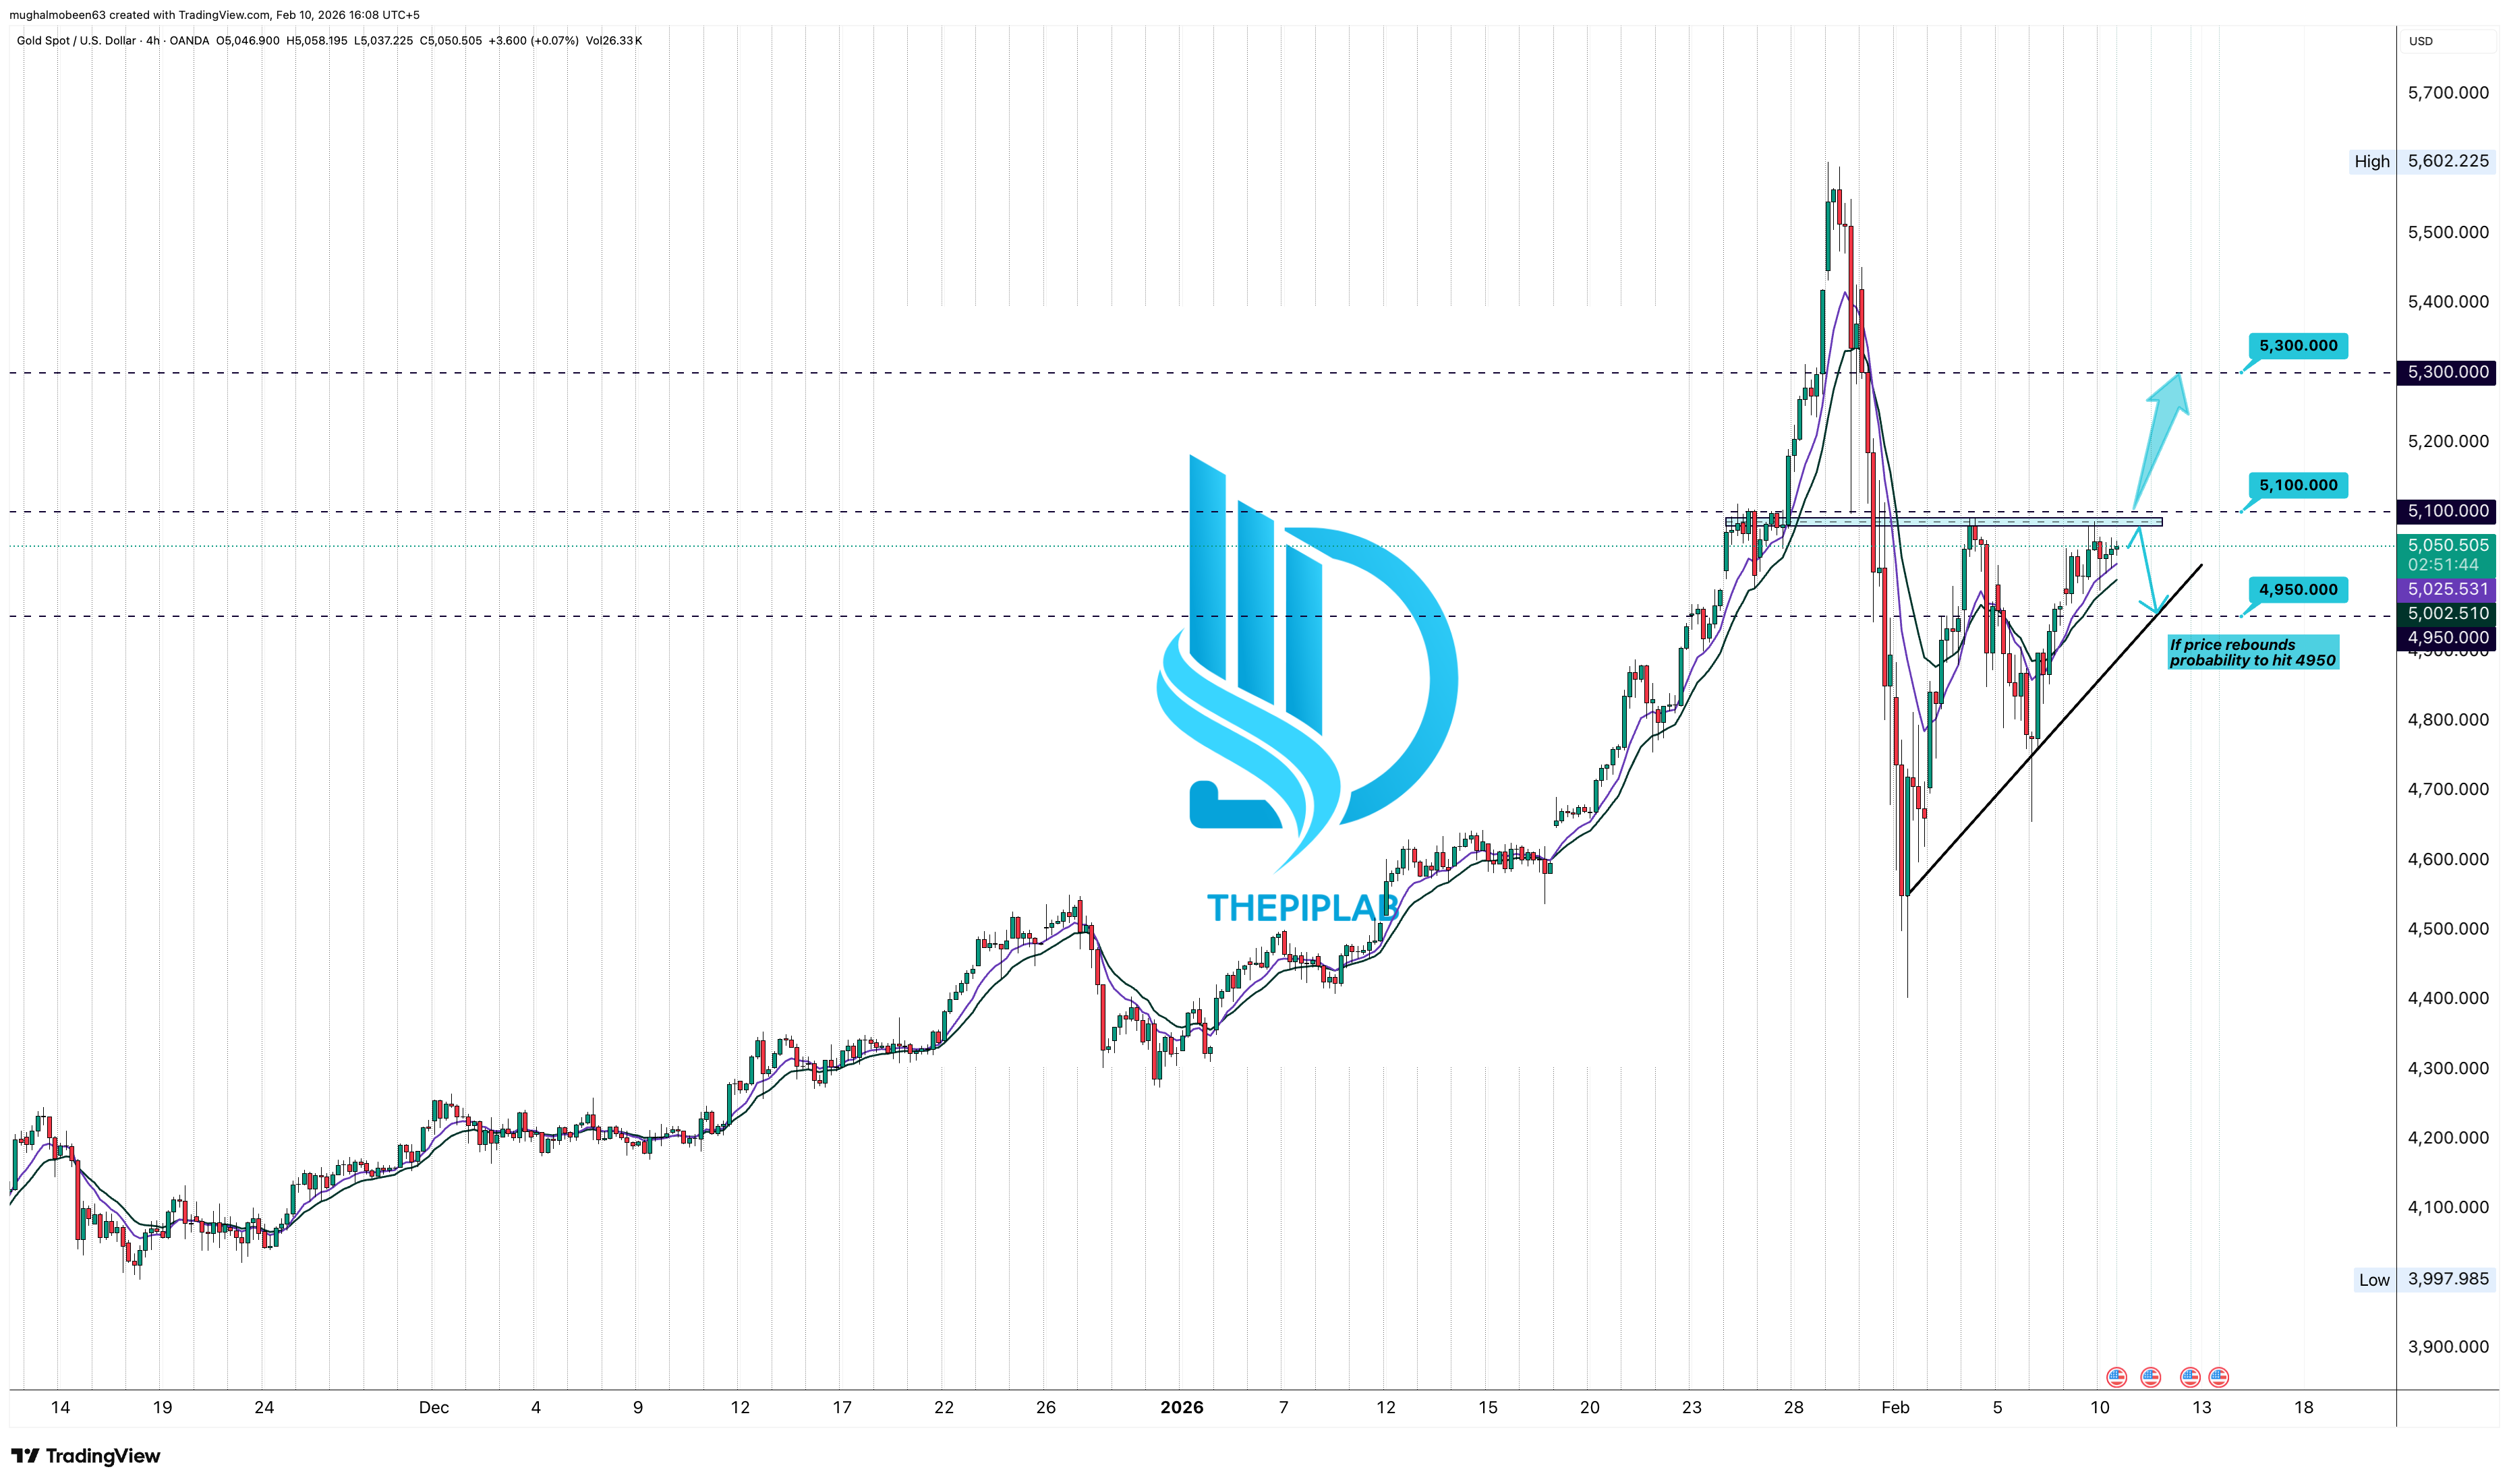
Gold is currently consolidating beneath the 5,100 resistance zone, forming a well-defined ascending triangle pattern supported by rising trendline structure. Historical market behavior shows that approximately 65–70% of the time, when price forms an ascending triangle after a bullish impulse, the market tends to break out in the direction of the prevailing trend.
Momentum conditions indicate growing bullish participation, while repeated higher lows suggest reduced selling pressure. The presence of upside imbalance near resistance highlights unfilled demand, increasing the probability of continuation if the structure remains intact.
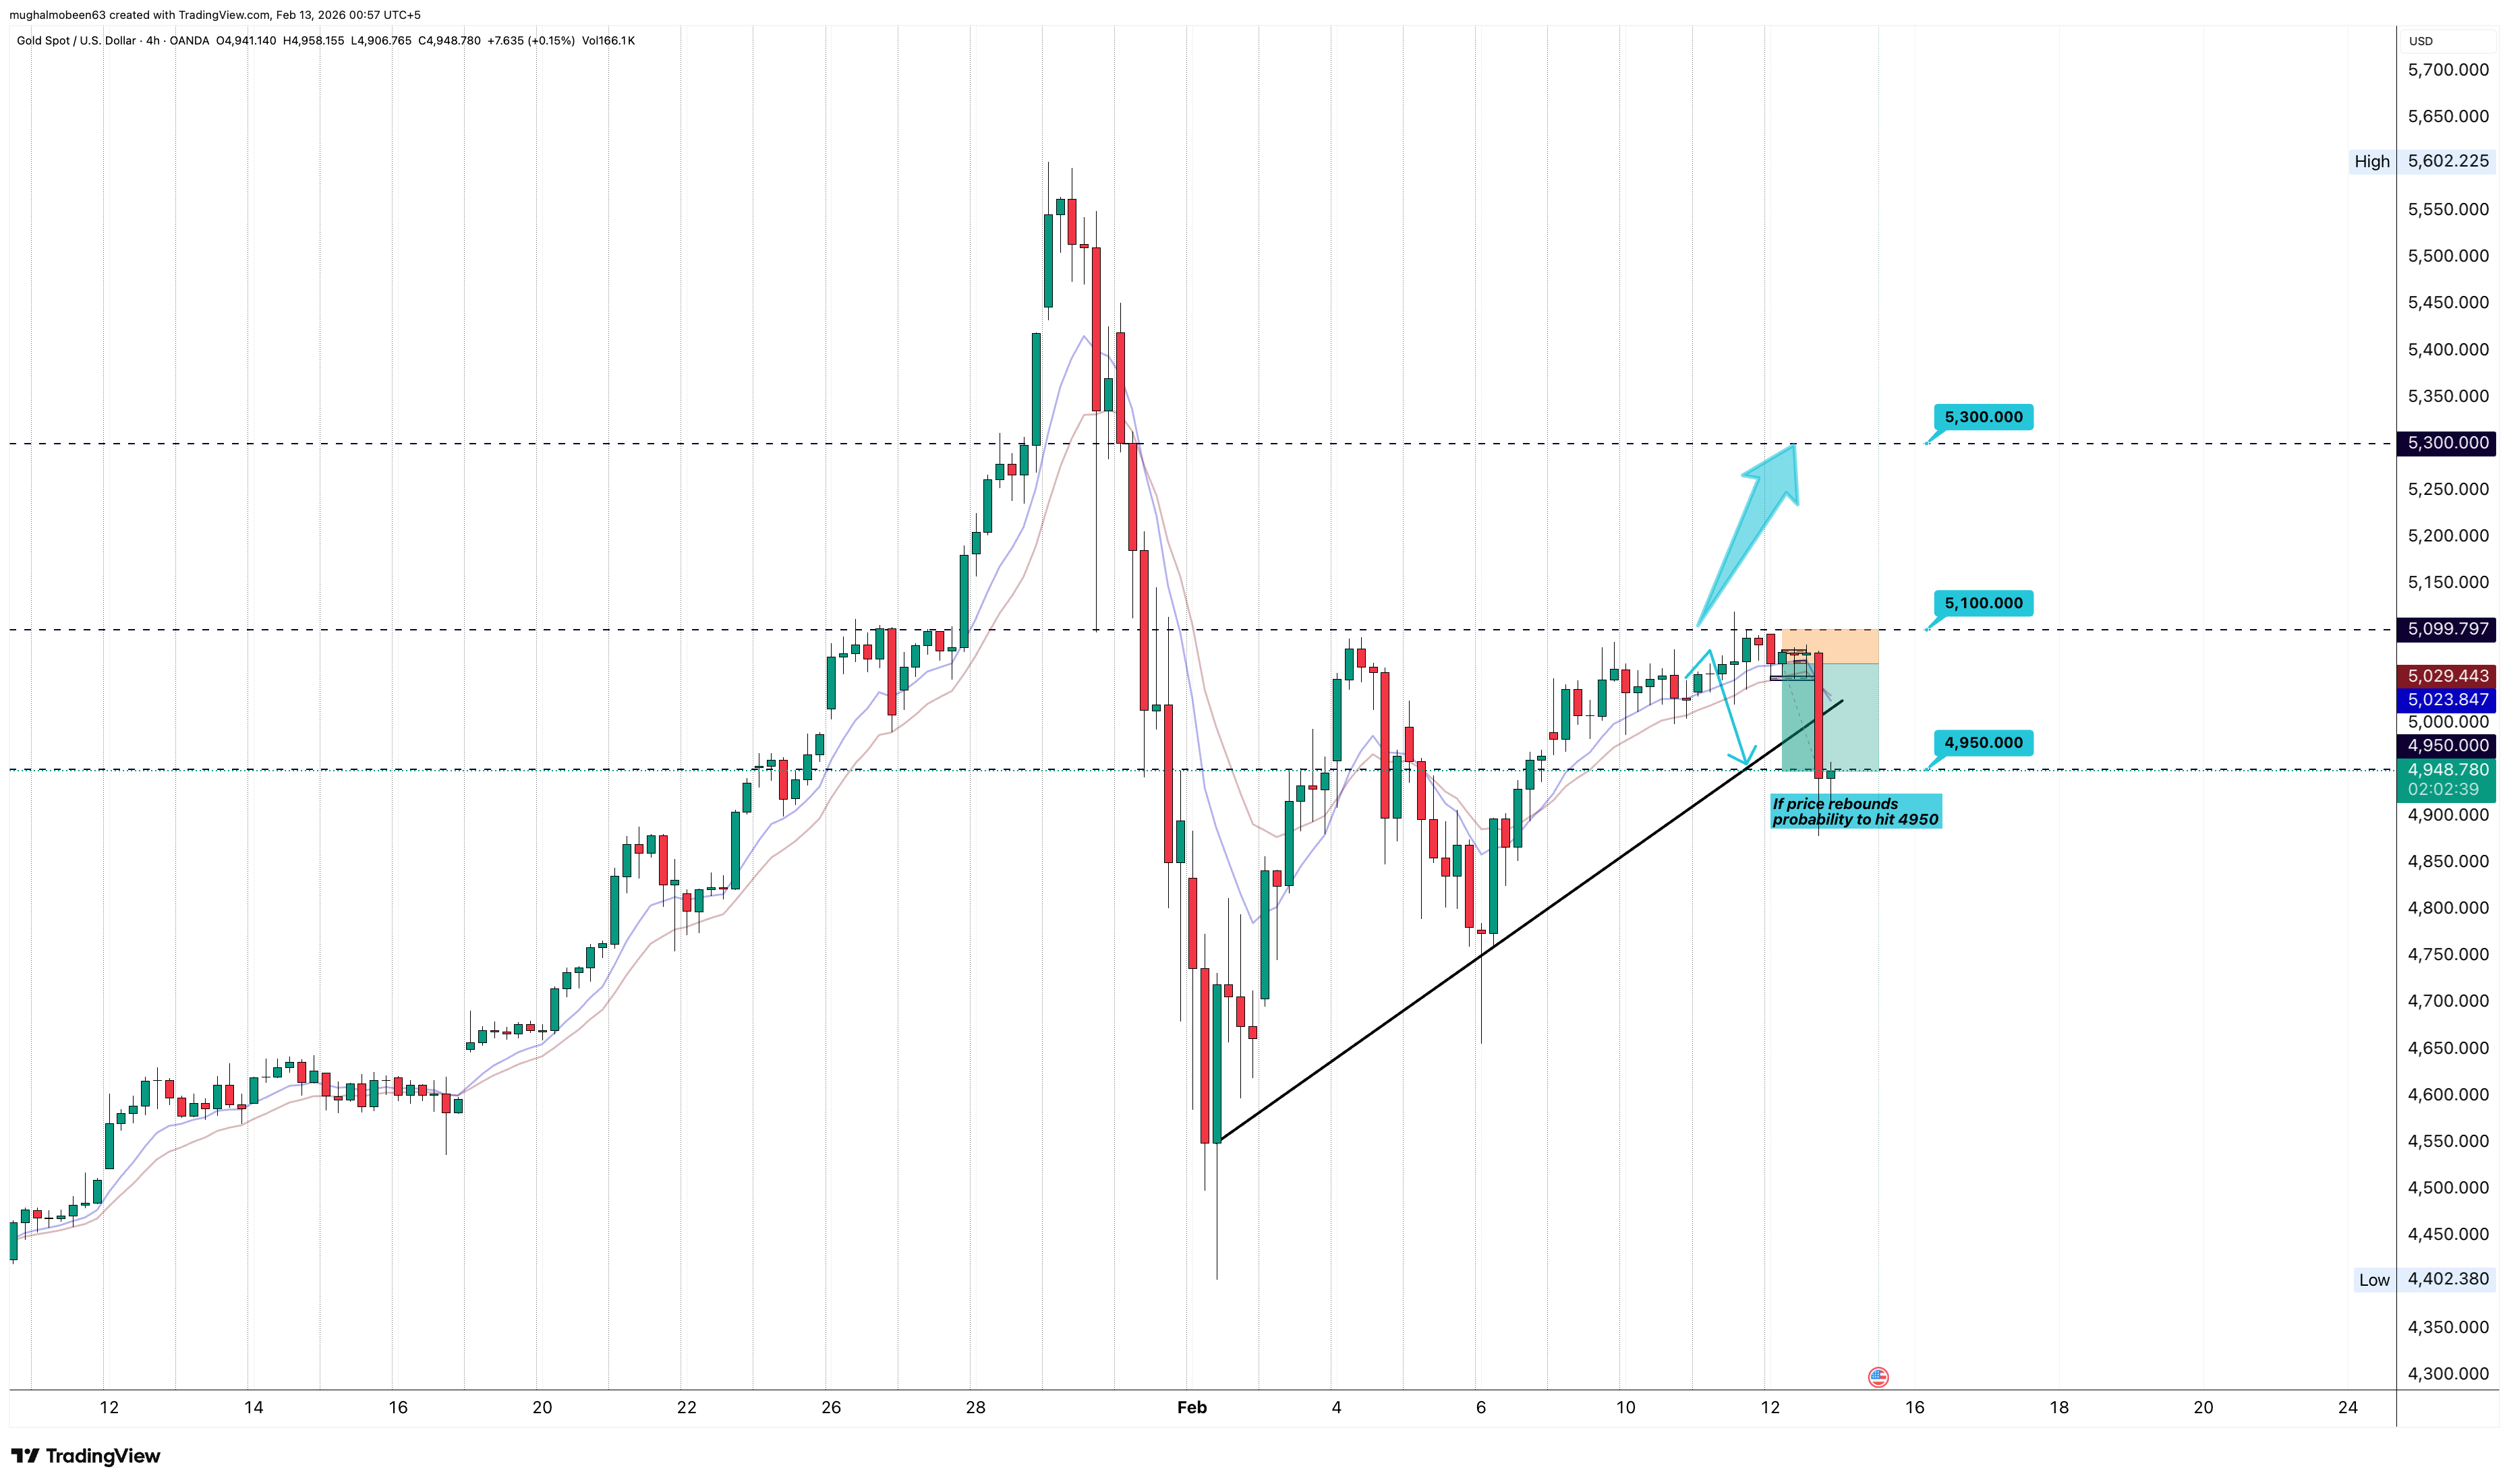
However, failure to sustain acceptance above 5,100 could trigger a short-term corrective move toward the 4,950 trendline support, which remains a technically important demand zone.
This analysis is probability-based and derived from historical structural behavior rather than certainty, and intraday volatility remains part of normal market dynamics.
Momentum conditions indicate growing bullish participation, while repeated higher lows suggest reduced selling pressure. The presence of upside imbalance near resistance highlights unfilled demand, increasing the probability of continuation if the structure remains intact.
However, failure to sustain acceptance above 5,100 could trigger a short-term corrective move toward the 4,950 trendline support, which remains a technically important demand zone.
This analysis is probability-based and derived from historical structural behavior rather than certainty, and intraday volatility remains part of normal market dynamics.