
← Back to Results
USD/JPY
Buy
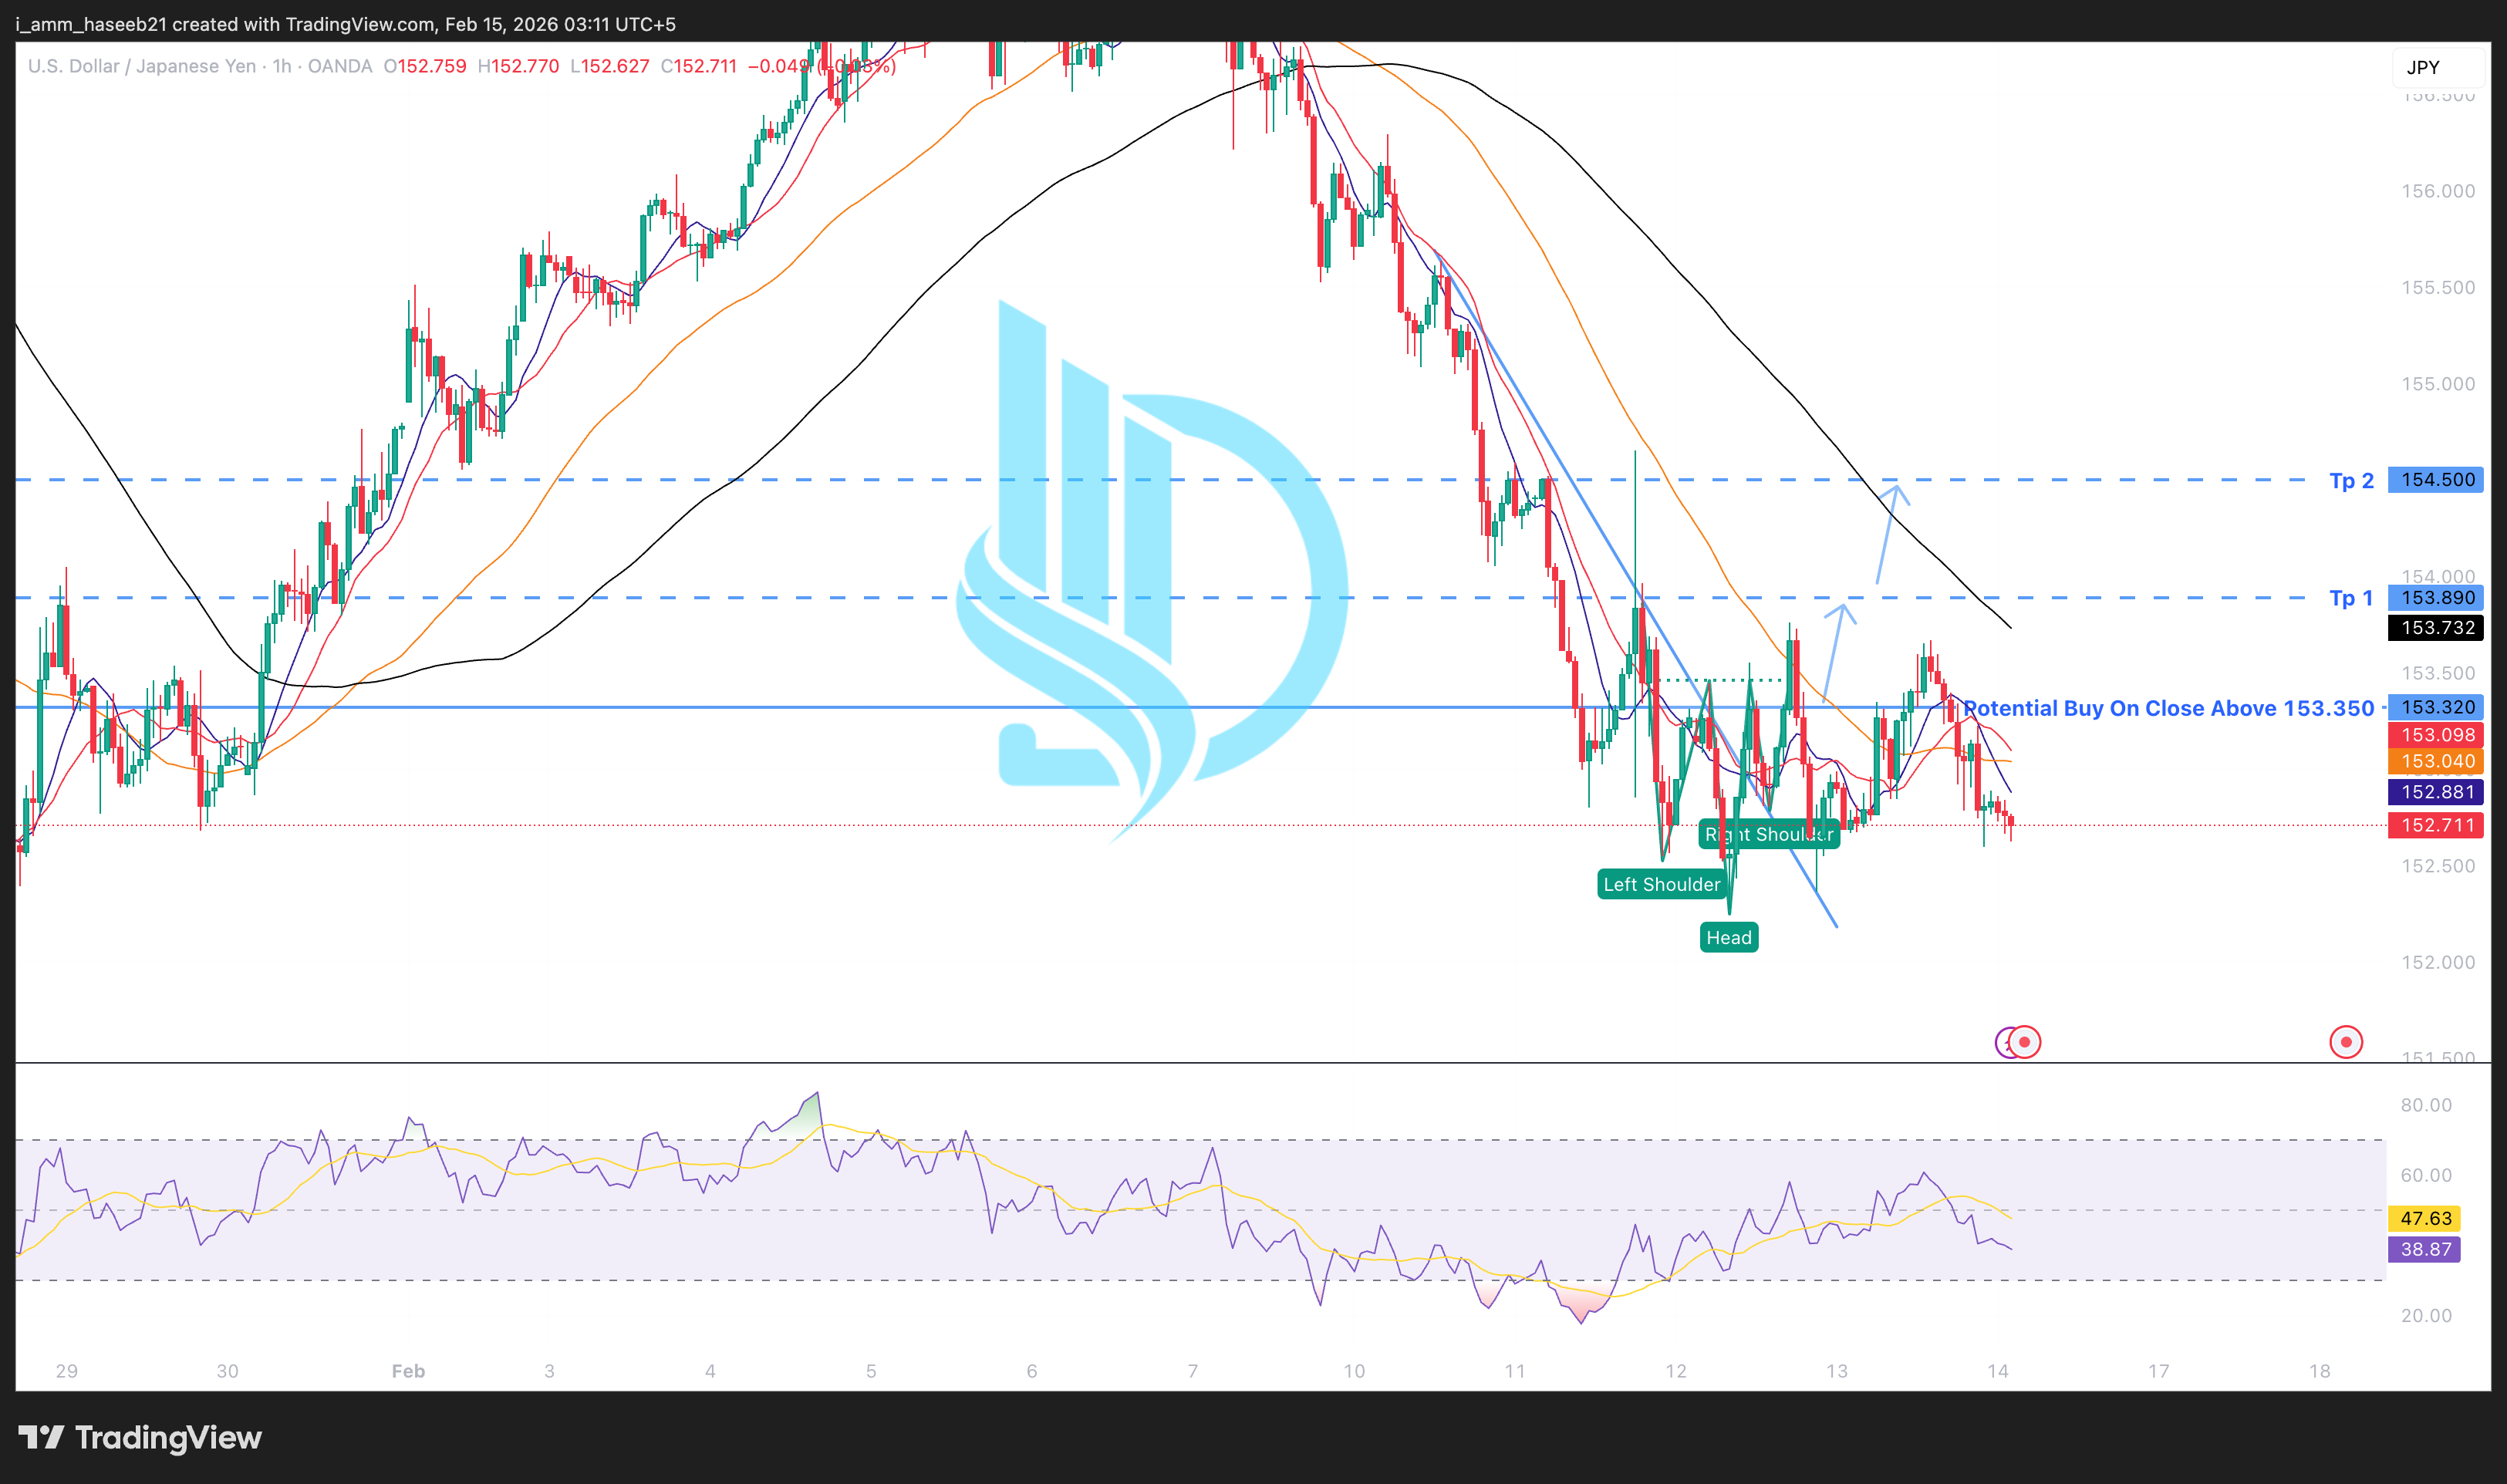
• SL Hit
• Updated 4 months ago
Description
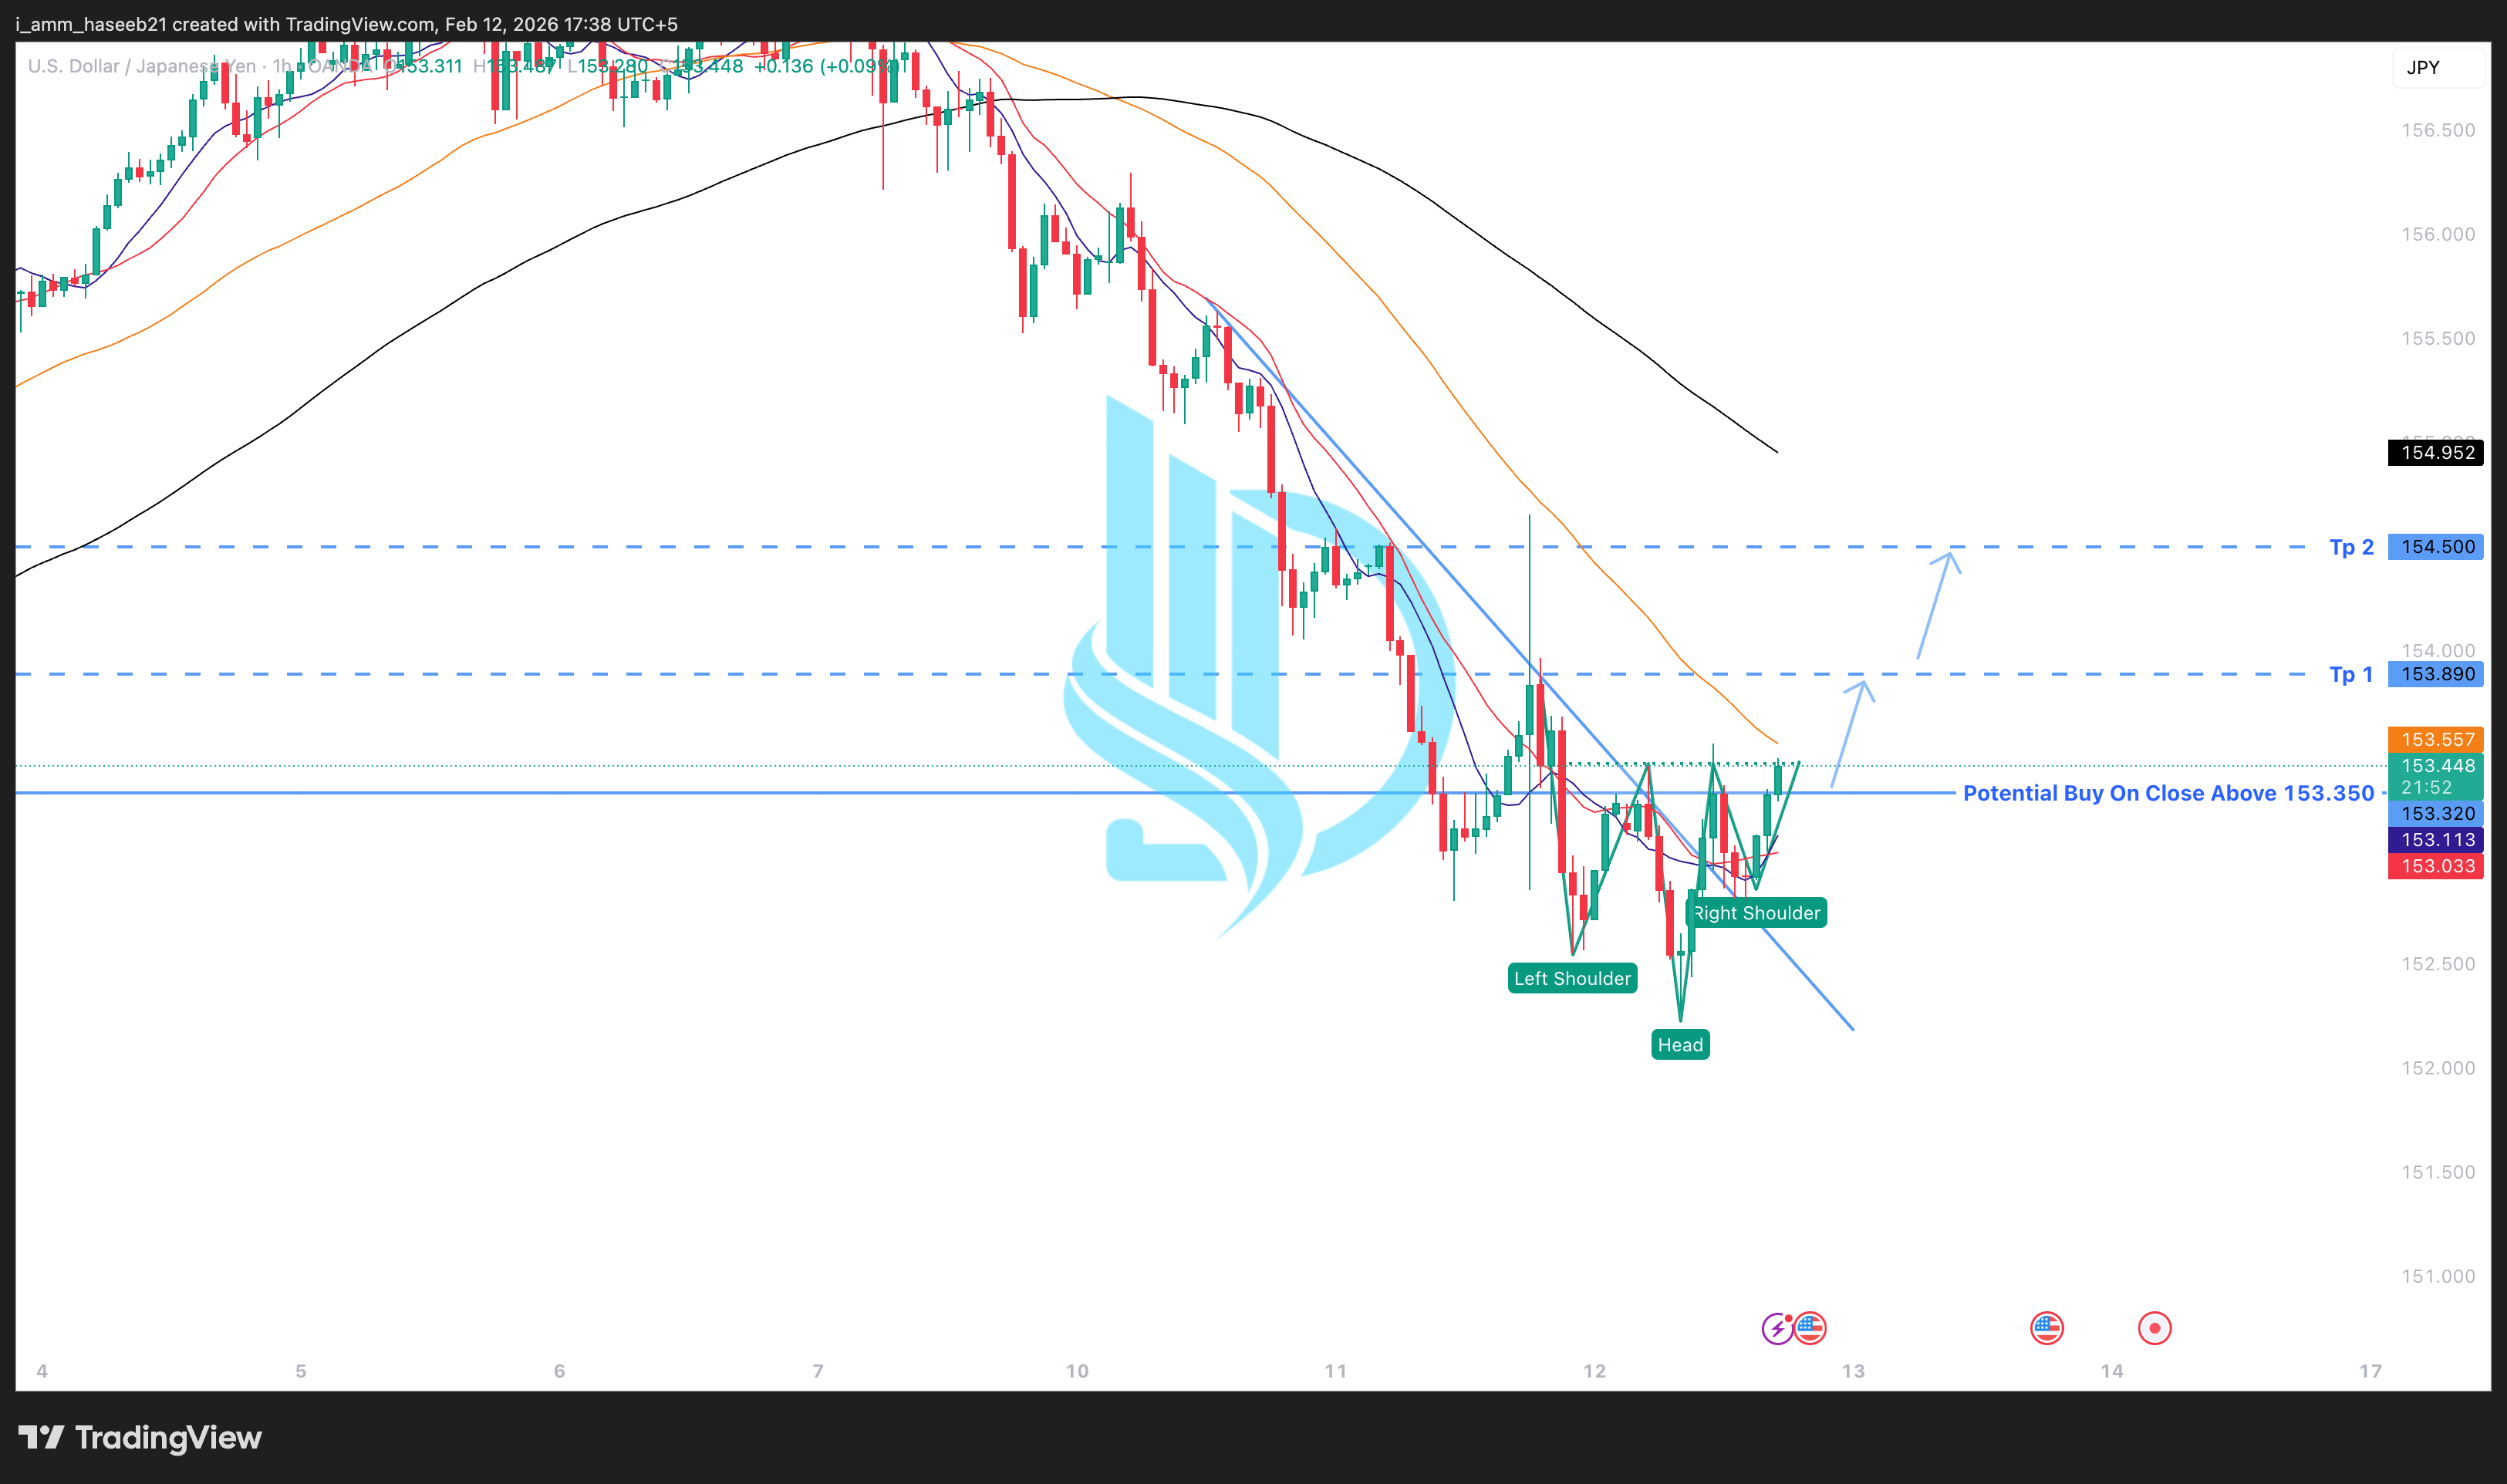
USD/JPY has been trading within a broader corrective decline; however, recent price action suggests the development of an inverse head & shoulders formation on the 1-hour timeframe. The pattern consists of a defined left shoulder, deeper head structure, and developing right shoulder, with resistance clustered near the neckline region around 153.35.
From a technical perspective:
Price is attempting to reclaim short-term moving averages after an extended decline.
Compression near the neckline indicates weakening bearish momentum.
The broader downtrend channel is being challenged, suggesting potential structural transition.
Historically, around 70% of the time, when an inverse head & shoulders pattern forms following a sustained decline and price achieves a confirmed close above the neckline, upside continuation toward measured resistance zones tends to follow.
The RSI is stabilizing from lower levels, reflecting reduced selling pressure and improving participation. A sustained close above neckline resistance would confirm acceptance and increase probability of continuation toward higher resistance levels.
From a risk perspective, a possible stop reference may be considered below the most recent swing low forming the right shoulder, allowing room for normal volatility while preserving structural validity of the reversal pattern.
While short-term volatility remains possible, confirmation above structure would indicate a potential transition phase from corrective decline to constructive bullish bias based on historical pattern behavior and technical alignment.