
← Back to Results
AUD/JPY
Sell
• Entry Criteria Not Met
• Updated 4 months ago
Description
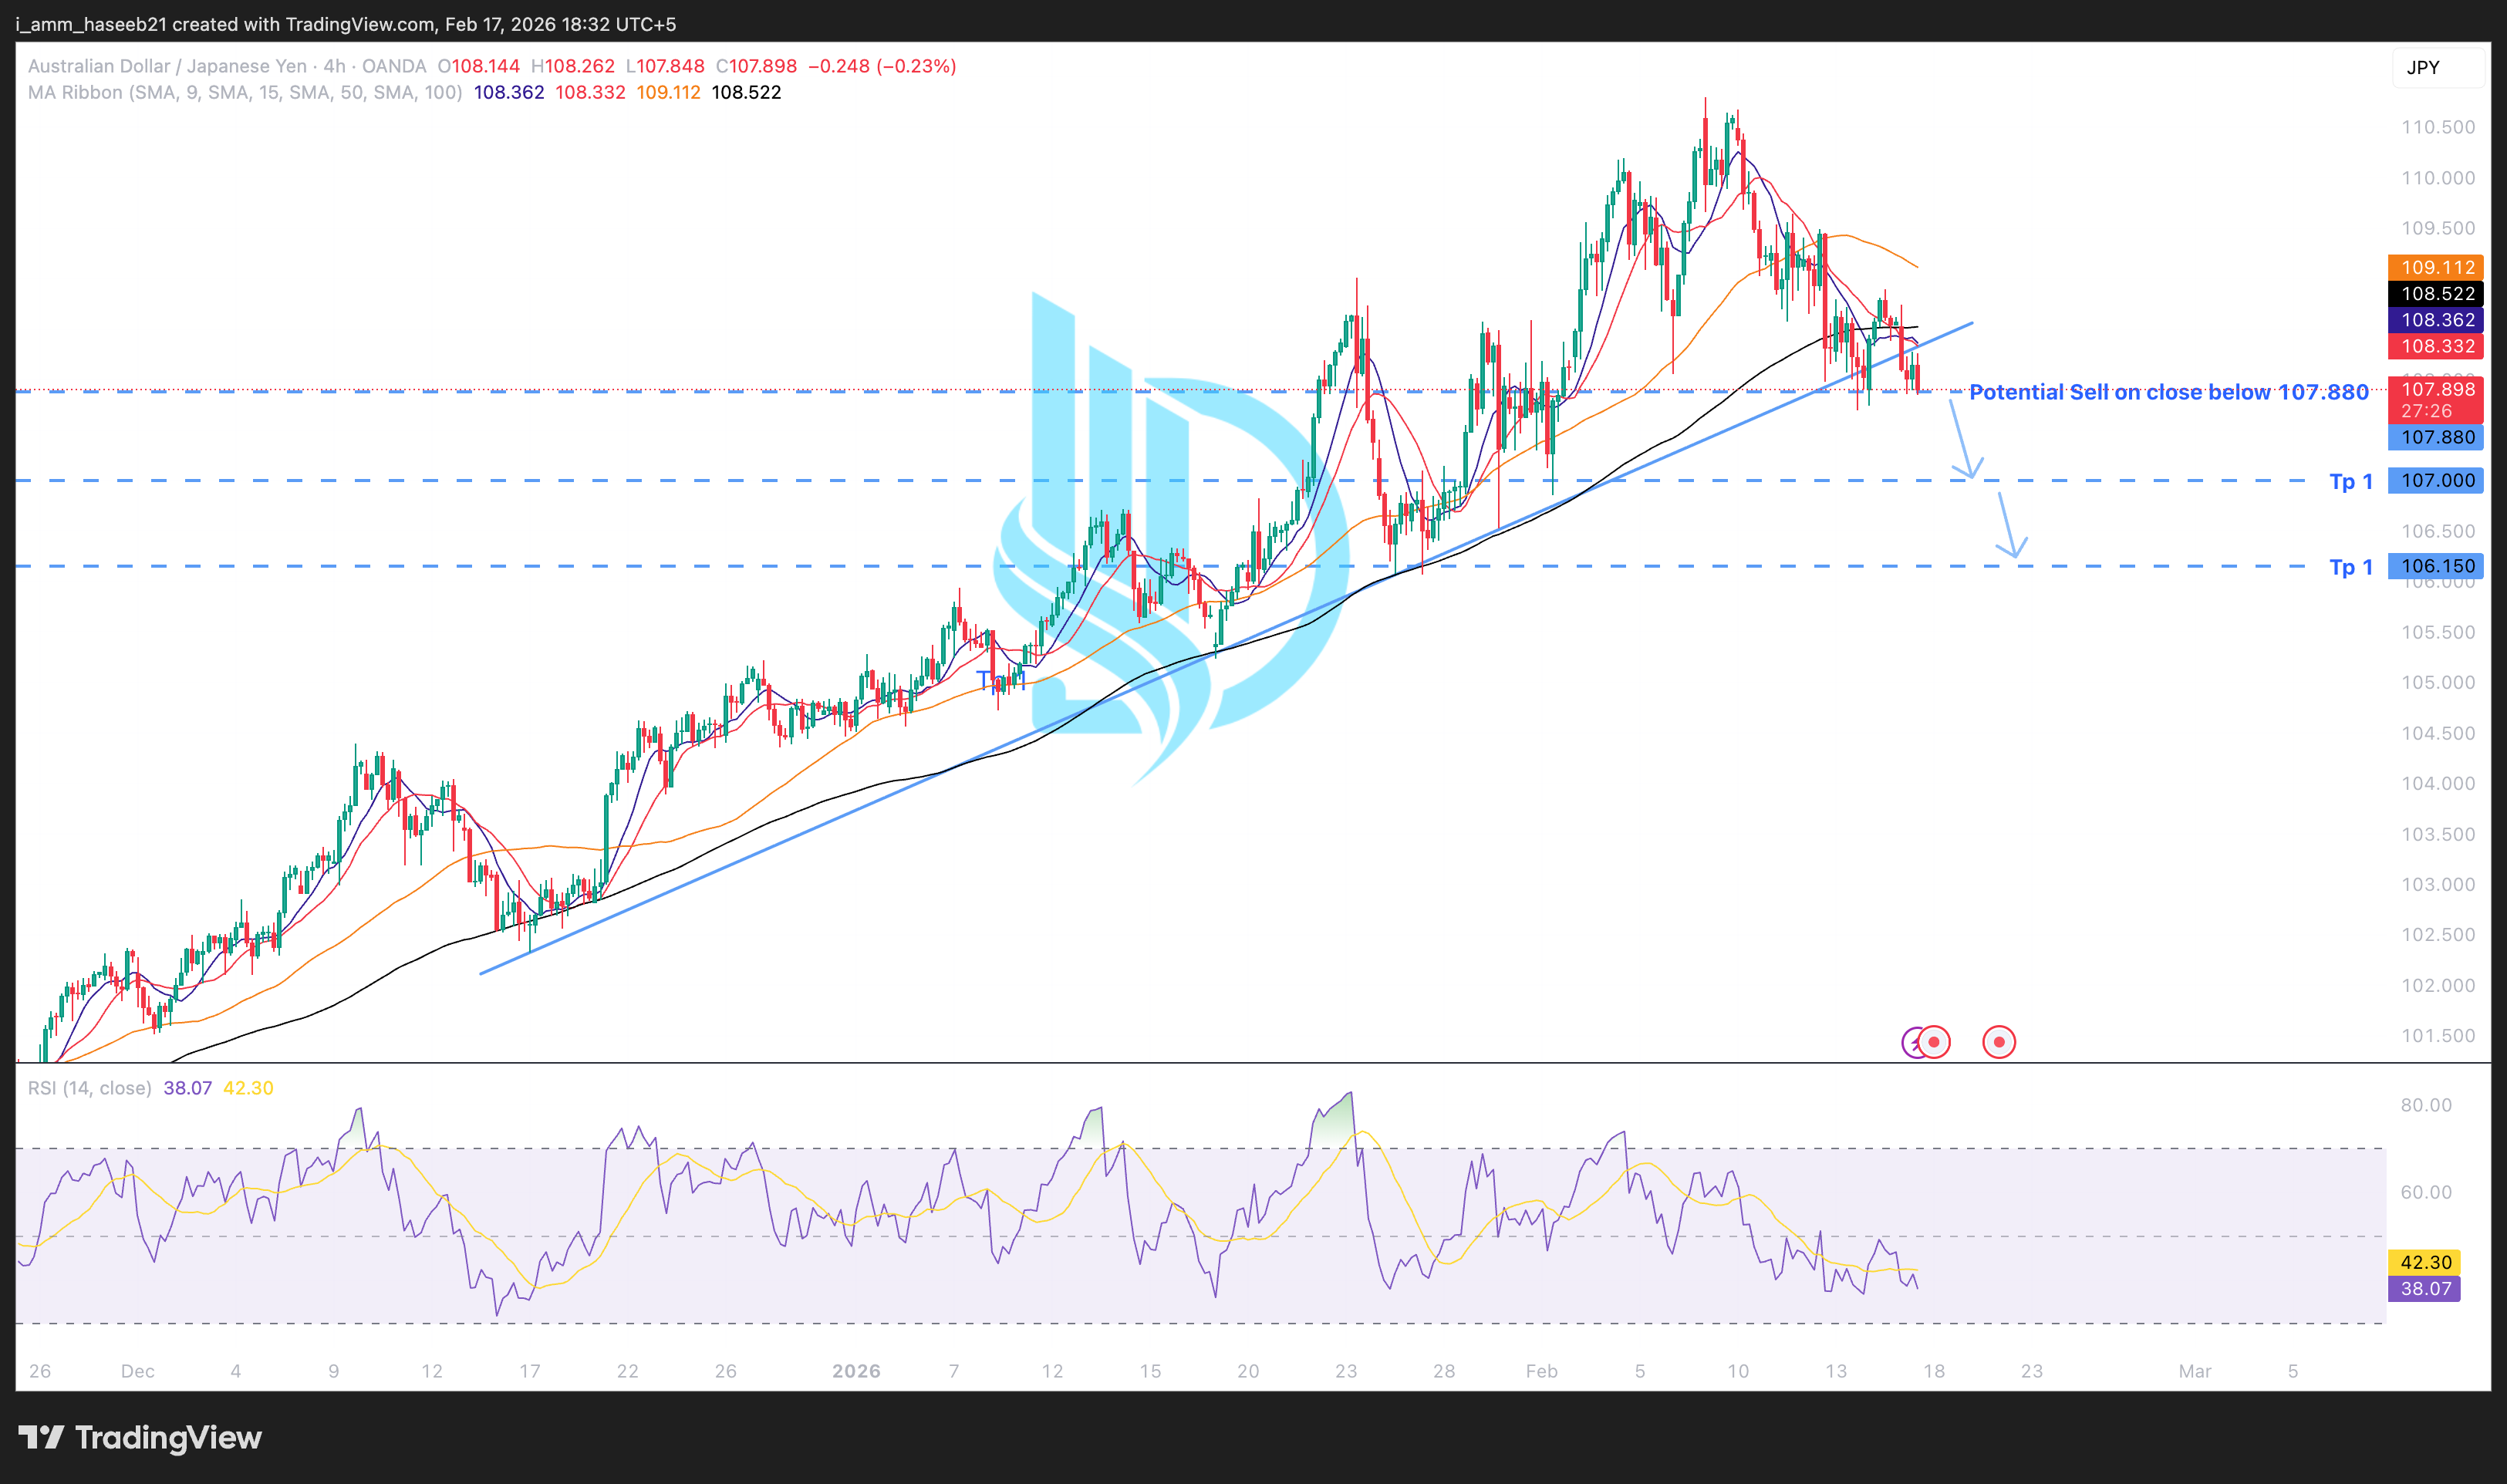
AUD/JPY has been trading within a broader ascending structure; however, recent price action suggests weakening bullish momentum and increasing downside pressure near trend support.
Price is now testing the rising trendline that previously acted as dynamic support. A confirmed close below this level would signal structural breakdown and potential shift into a deeper corrective phase.
From a technical perspective:
Price is slipping below short-term moving averages, showing momentum deterioration.
The 50-period average is flattening, suggesting slowing upside pressure.
The 200-period moving average remains below price but is being approached, indicating potential mean-reversion behavior.
RSI is trading near the lower boundary of the mid-range and trending downward, reflecting weakening momentum rather than bullish continuation.
Historically, around 70% of the time, when price breaks below a rising trendline after extended upside movement — particularly with weakening RSI and compressing moving averages — the market tends to enter a corrective retracement phase toward prior horizontal support levels.
If price achieves sustained acceptance below 107.88, continuation toward the 107.00 and 106.15 zones may gradually unfold.
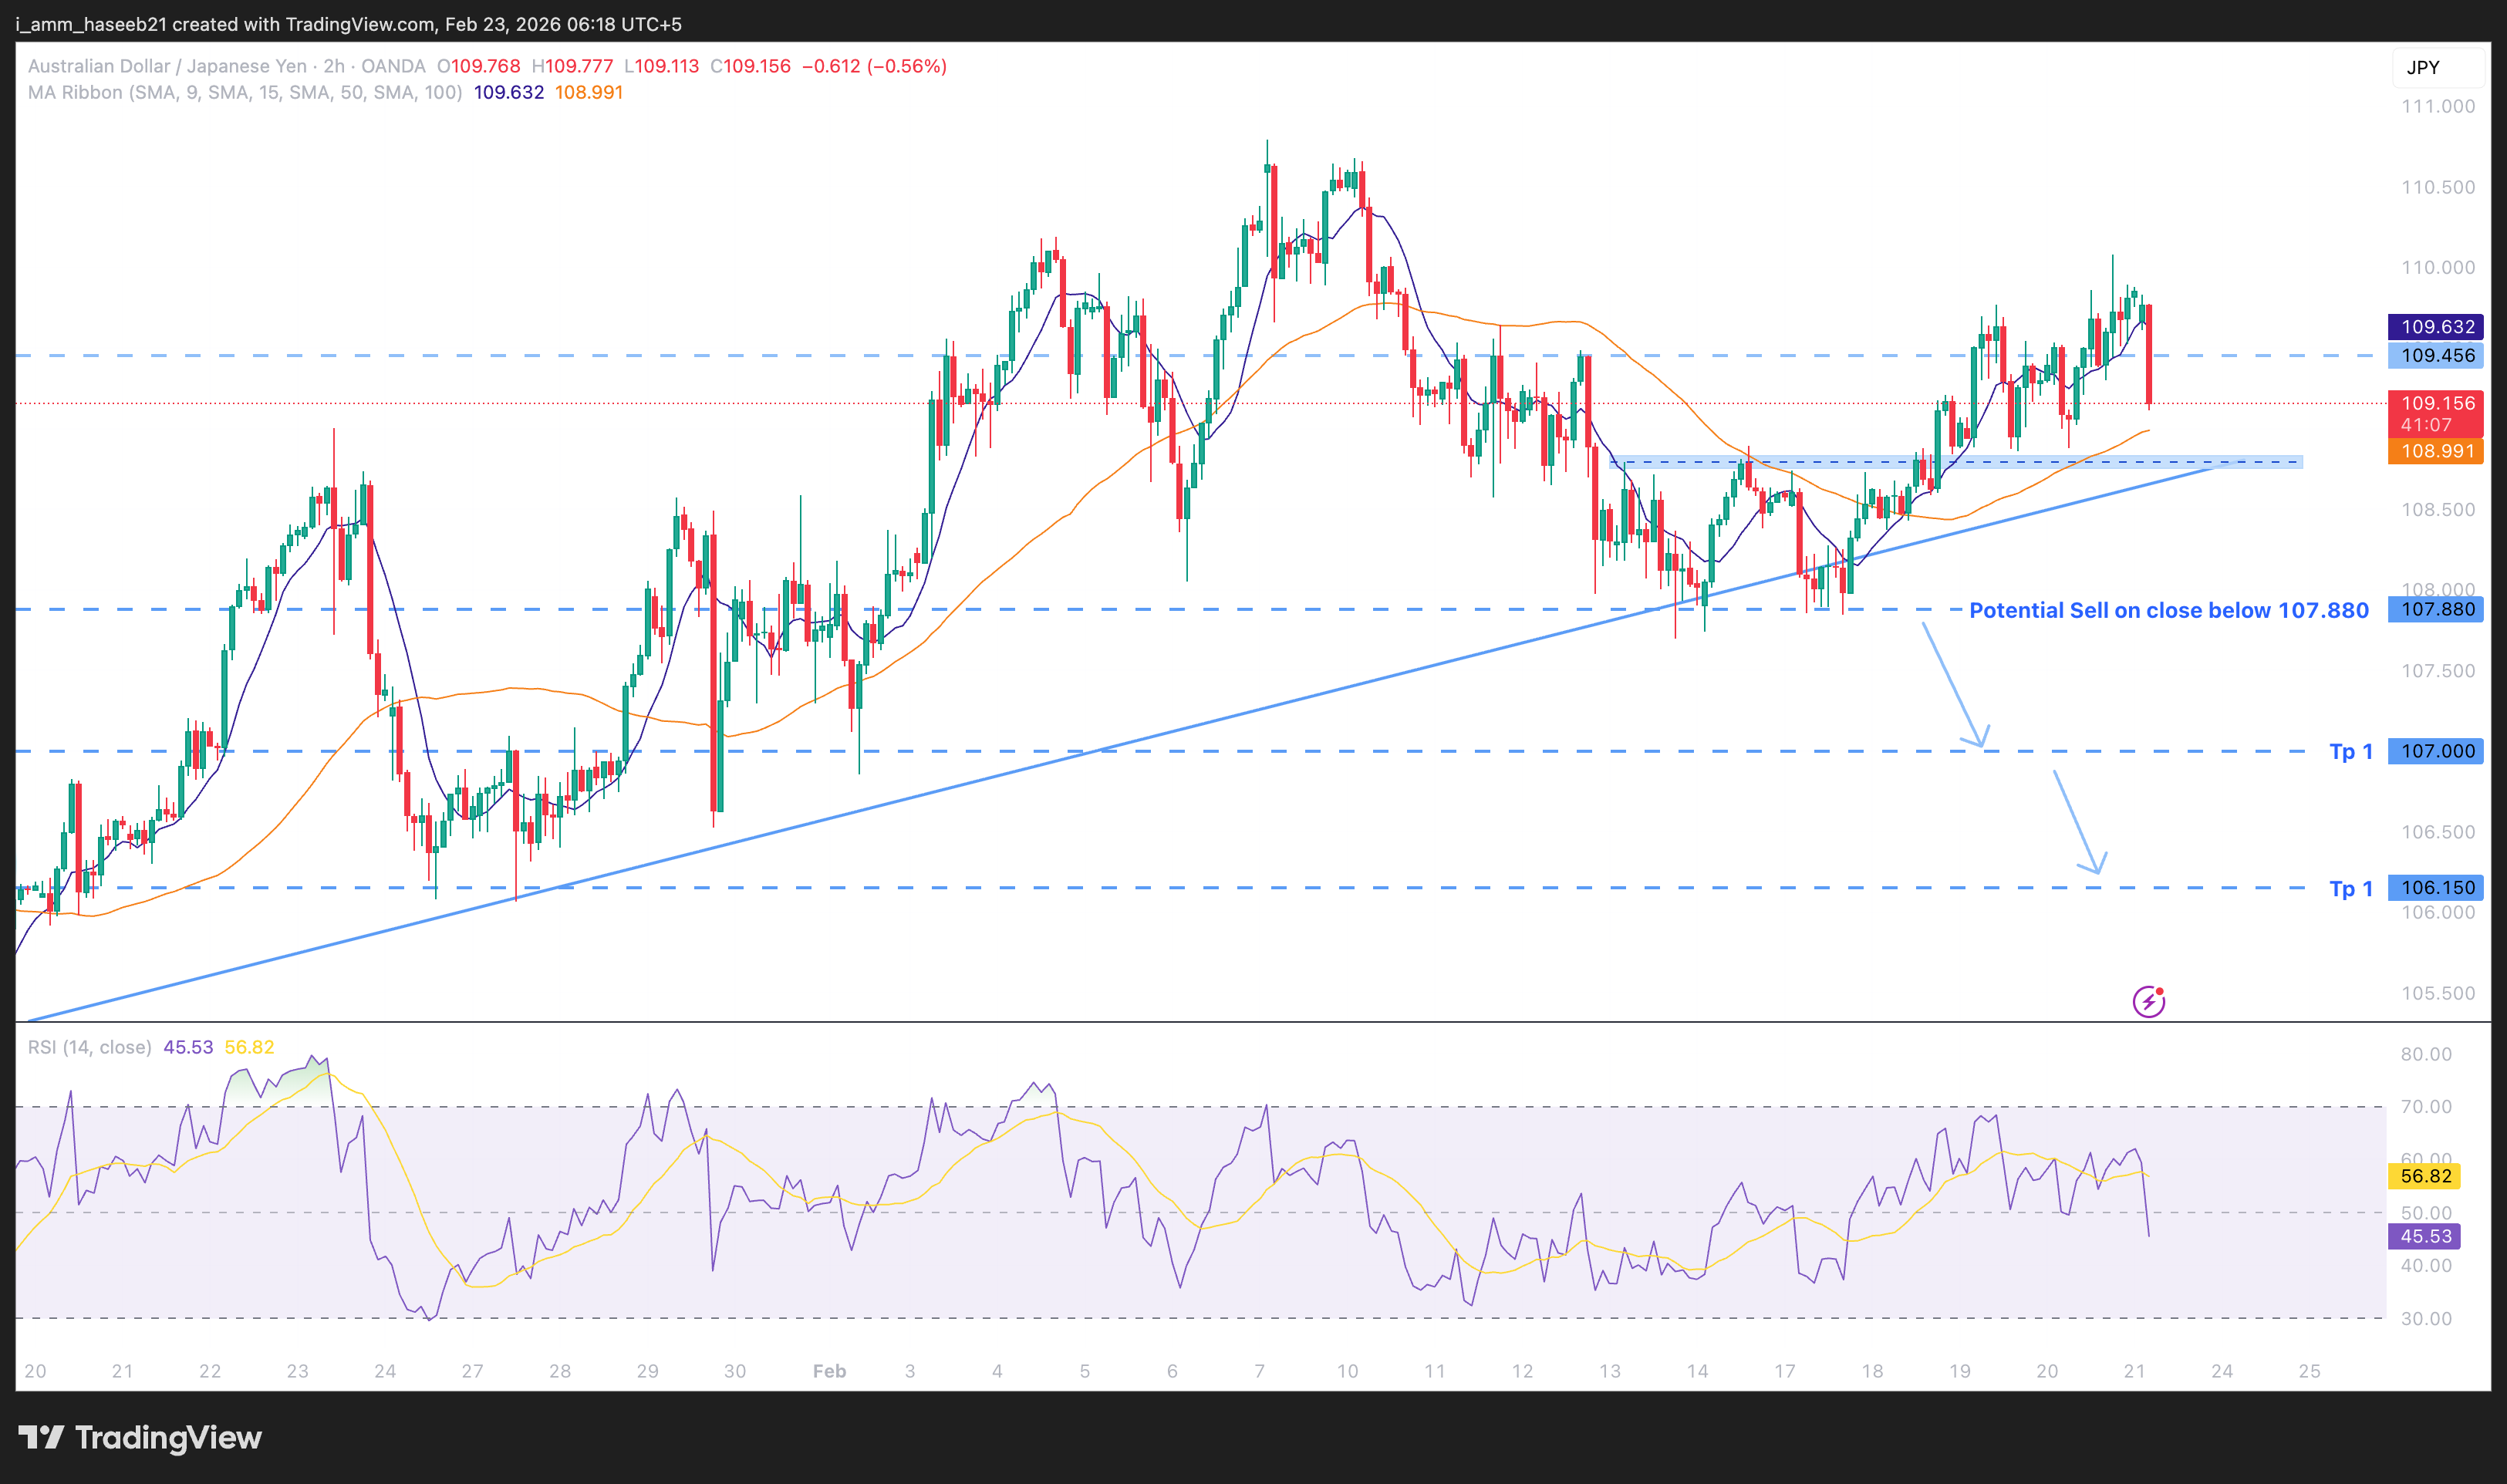