
← Back to Results
GBP/JPY
Buy
• TP Hit
• Updated 4 months ago
Description
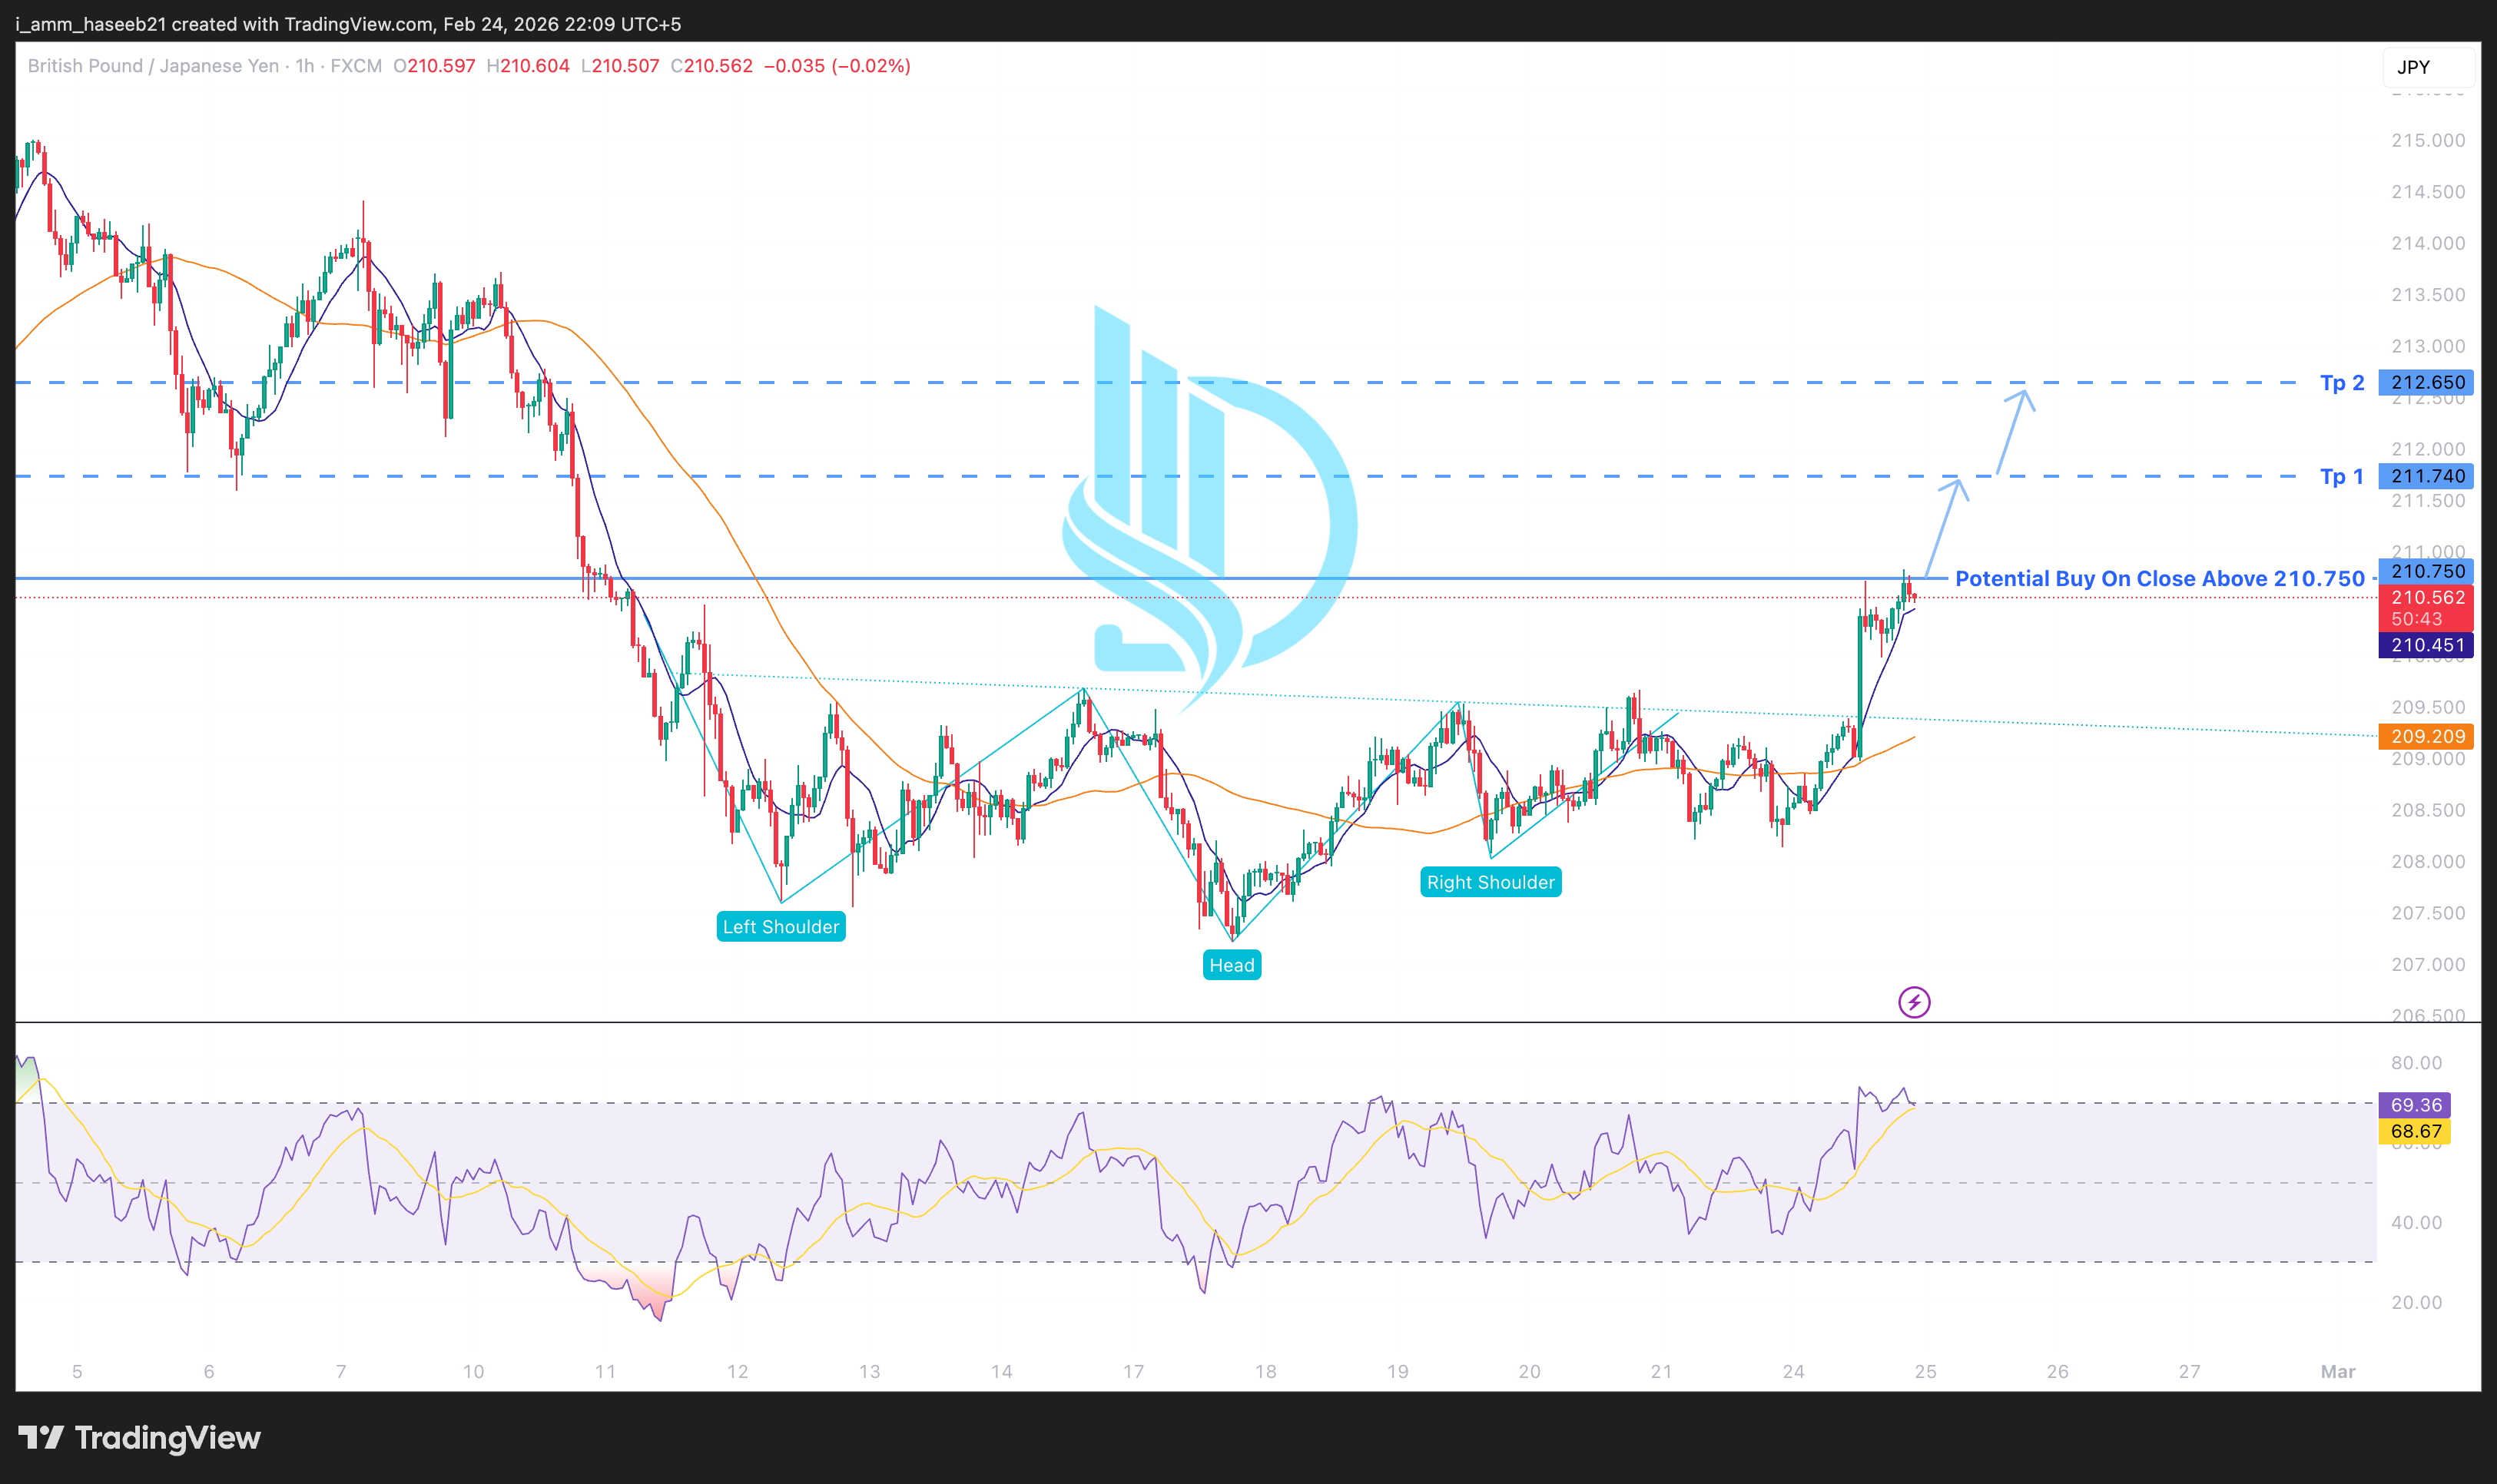
GBP/JPY has formed a well-defined inverse head & shoulders structure on the 1-hour timeframe, consisting of a clear left shoulder, deeper head formation, and higher right shoulder. Price is now challenging the neckline region around 210.75.
From a technical perspective:
The reversal formation suggests exhaustion of prior downside pressure.
Price has reclaimed short-term moving averages and is now trading above them.
The 50-period moving average is turning upward, indicating momentum shift.
RSI is holding near overbought territory but remains constructive, reflecting strong participation rather than immediate rejection.
Historically, around 70% of the time, when price breaks above the neckline of an inverse head & shoulders pattern with rising momentum and moving average alignment, continuation toward measured resistance zones tends to follow.
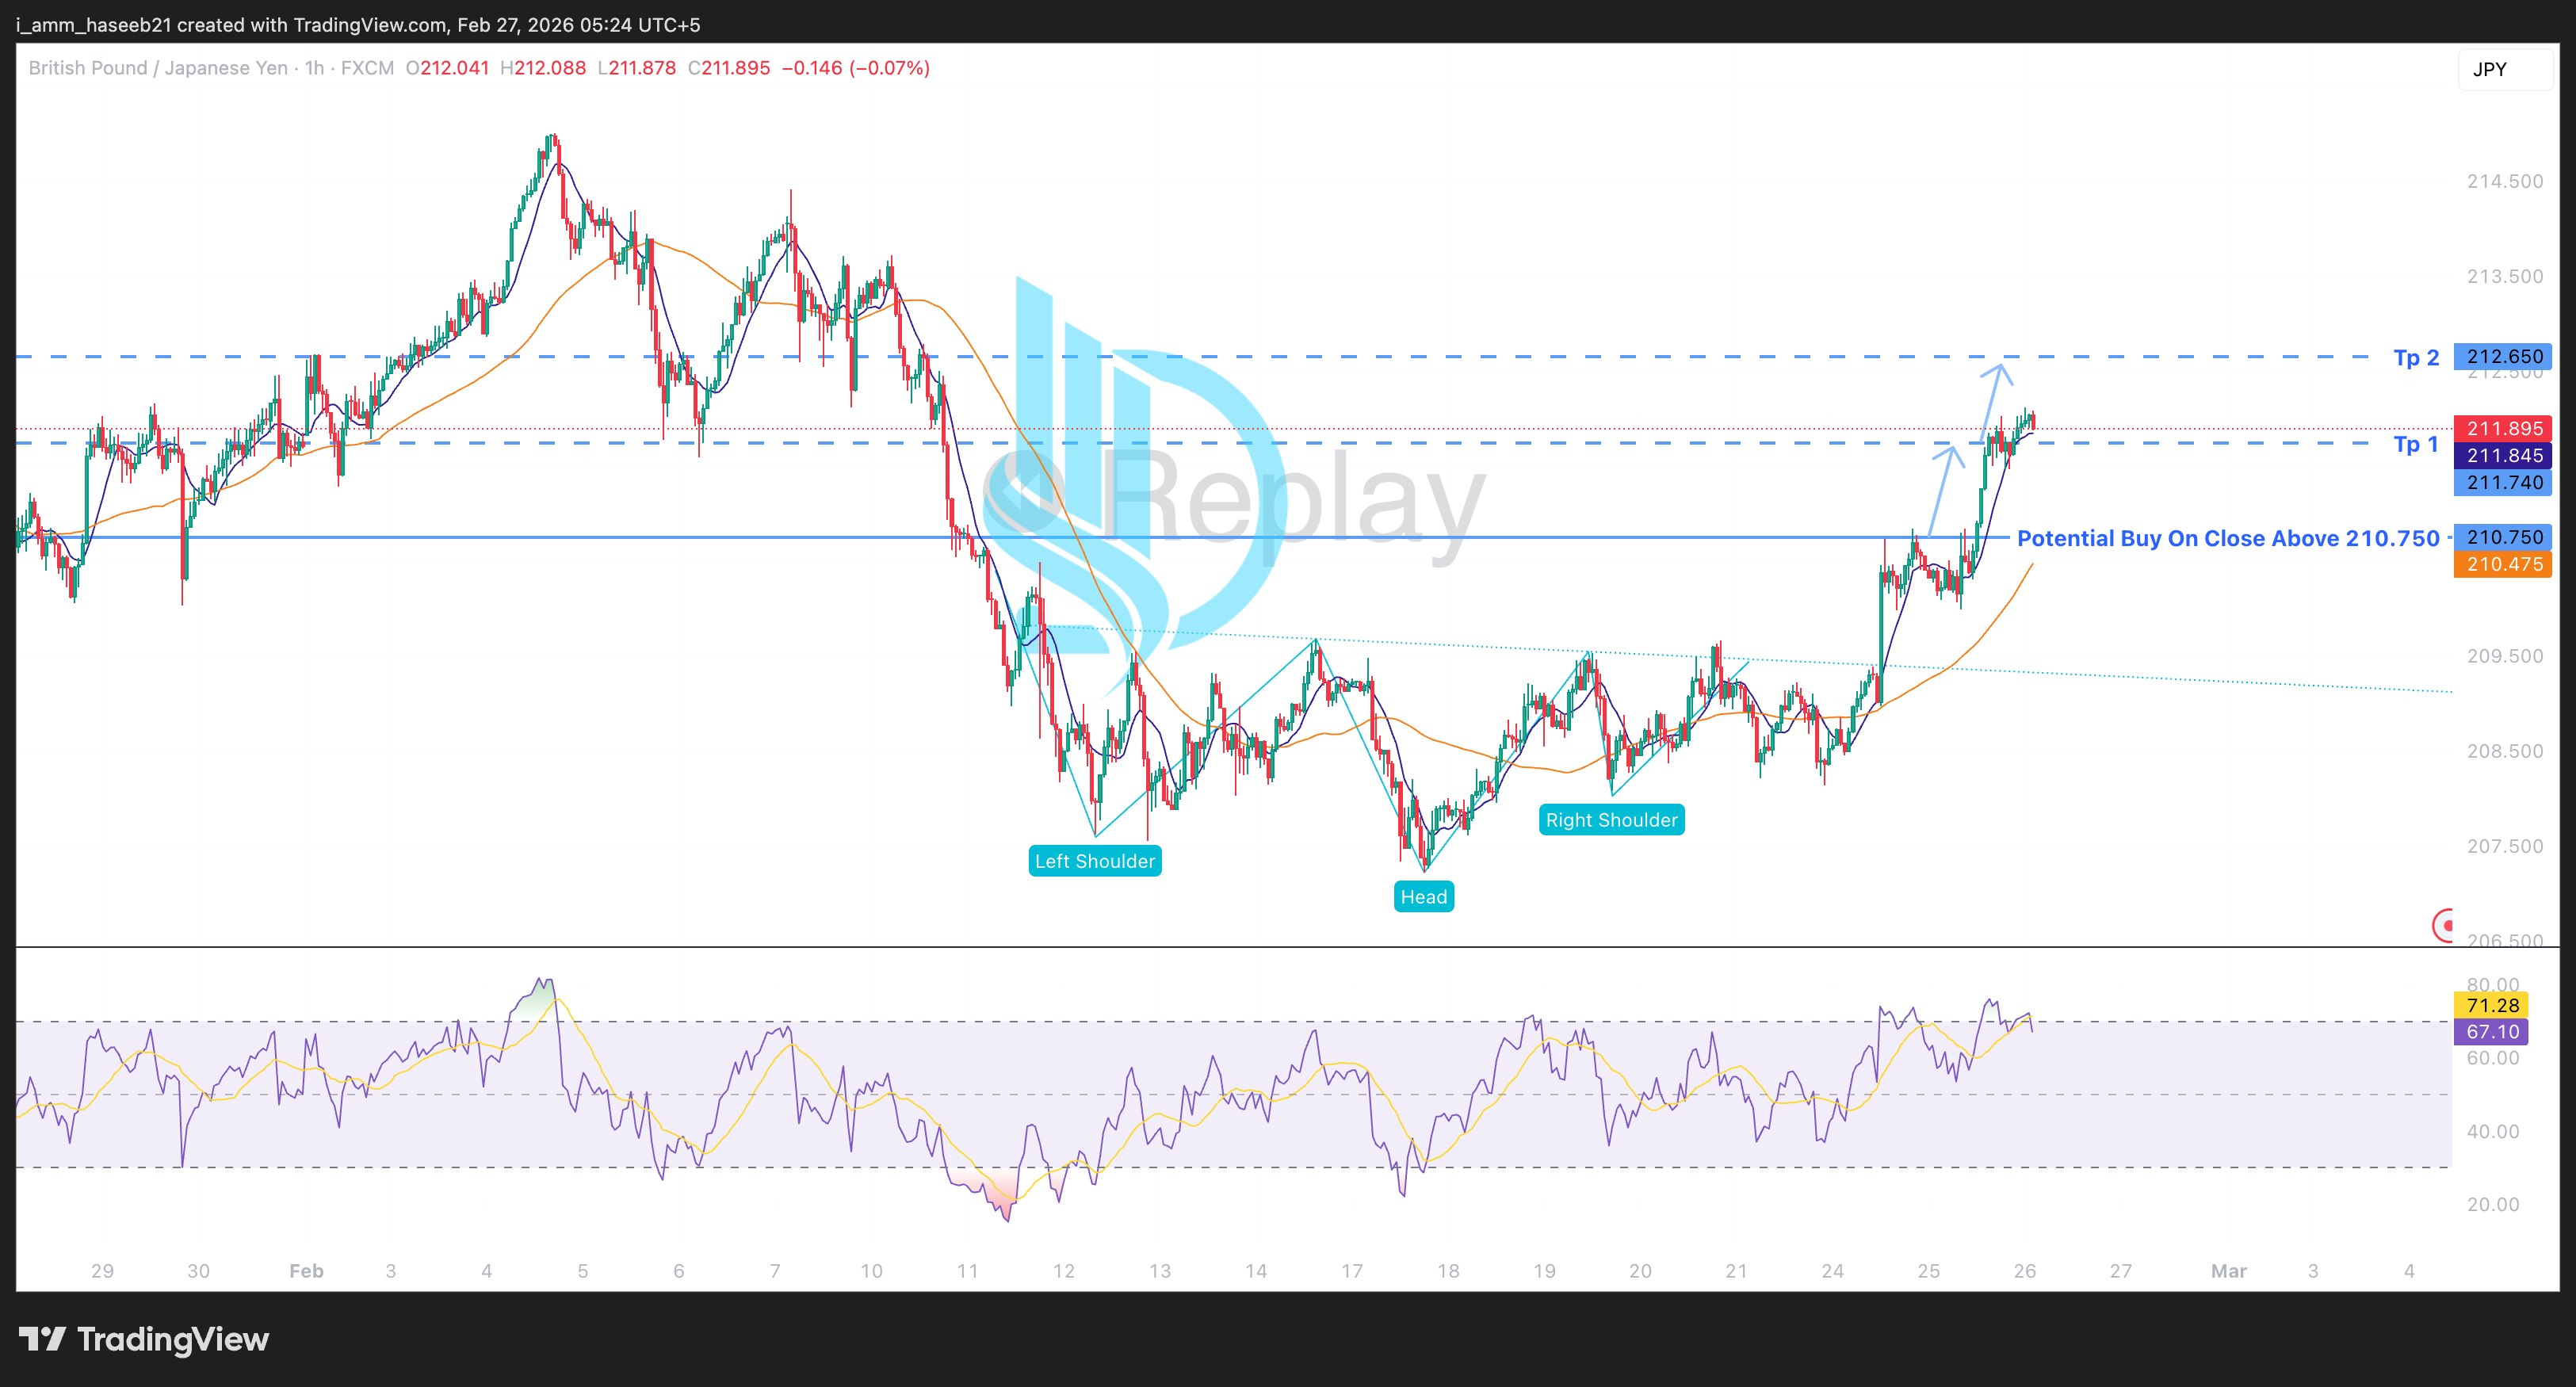
A sustained close above 210.75 would confirm structural acceptance and increase probability of continuation toward 211.74 and potentially 212.65.
From a risk perspective, a possible stop reference may be considered below the most recent higher low forming the right shoulder, preserving structural invalidation should price fall back below neckline support.
While short-term pullbacks remain possible due to breakout volatility, current structure and momentum alignment support a constructive bullish continuation scenario.
From a technical perspective:
The reversal formation suggests exhaustion of prior downside pressure.
Price has reclaimed short-term moving averages and is now trading above them.
The 50-period moving average is turning upward, indicating momentum shift.
RSI is holding near overbought territory but remains constructive, reflecting strong participation rather than immediate rejection.
Historically, around 70% of the time, when price breaks above the neckline of an inverse head & shoulders pattern with rising momentum and moving average alignment, continuation toward measured resistance zones tends to follow.
A sustained close above 210.75 would confirm structural acceptance and increase probability of continuation toward 211.74 and potentially 212.65.
From a risk perspective, a possible stop reference may be considered below the most recent higher low forming the right shoulder, preserving structural invalidation should price fall back below neckline support.
While short-term pullbacks remain possible due to breakout volatility, current structure and momentum alignment support a constructive bullish continuation scenario.