
← Back to Results
USD/JPY
Sell
• Entry Criteria Not Met
• Updated 7 months ago
Description
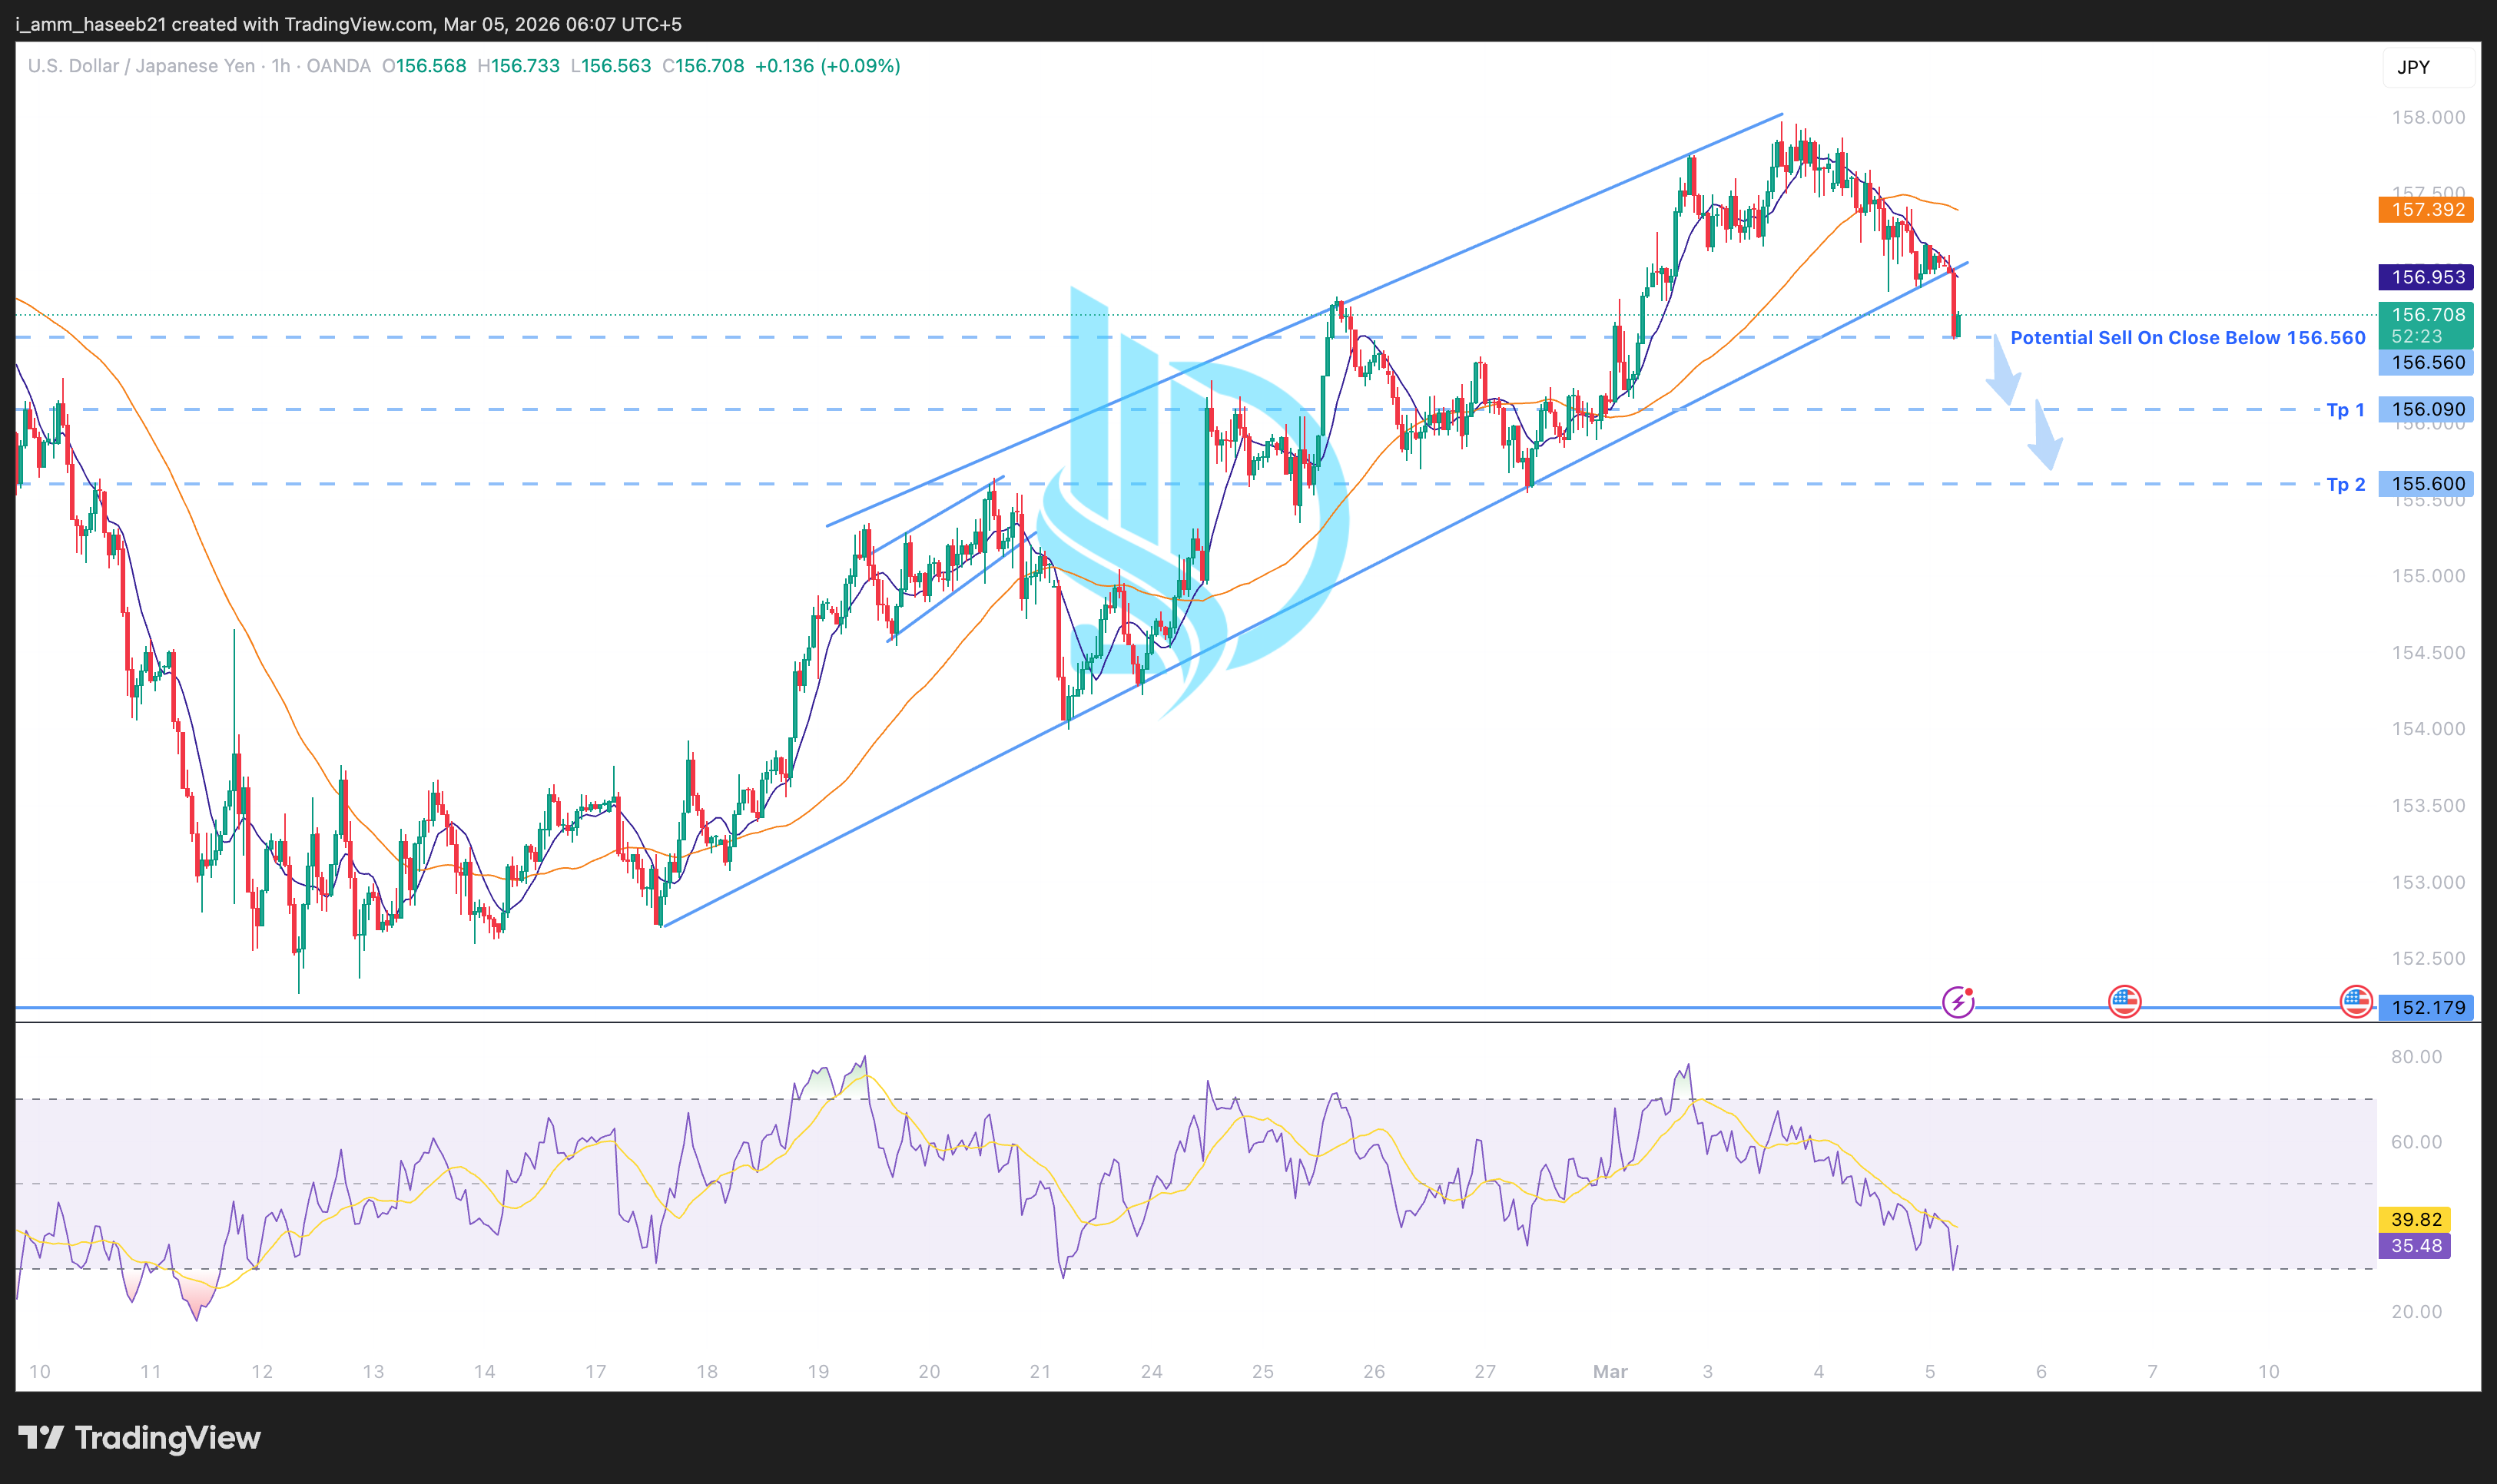
USD/JPY has been trading inside a rising channel, but price is currently testing the lower boundary of the channel, which is a critical structural support area. Momentum is weakening and price is starting to lose bullish strength.
Technical observations:
Price breaking down from ascending channel structure
Lower highs forming after recent rejection near the channel top
Price moving below short-term moving averages
Bearish momentum increasing
RSI dropping toward the oversold region, showing strong downside pressure
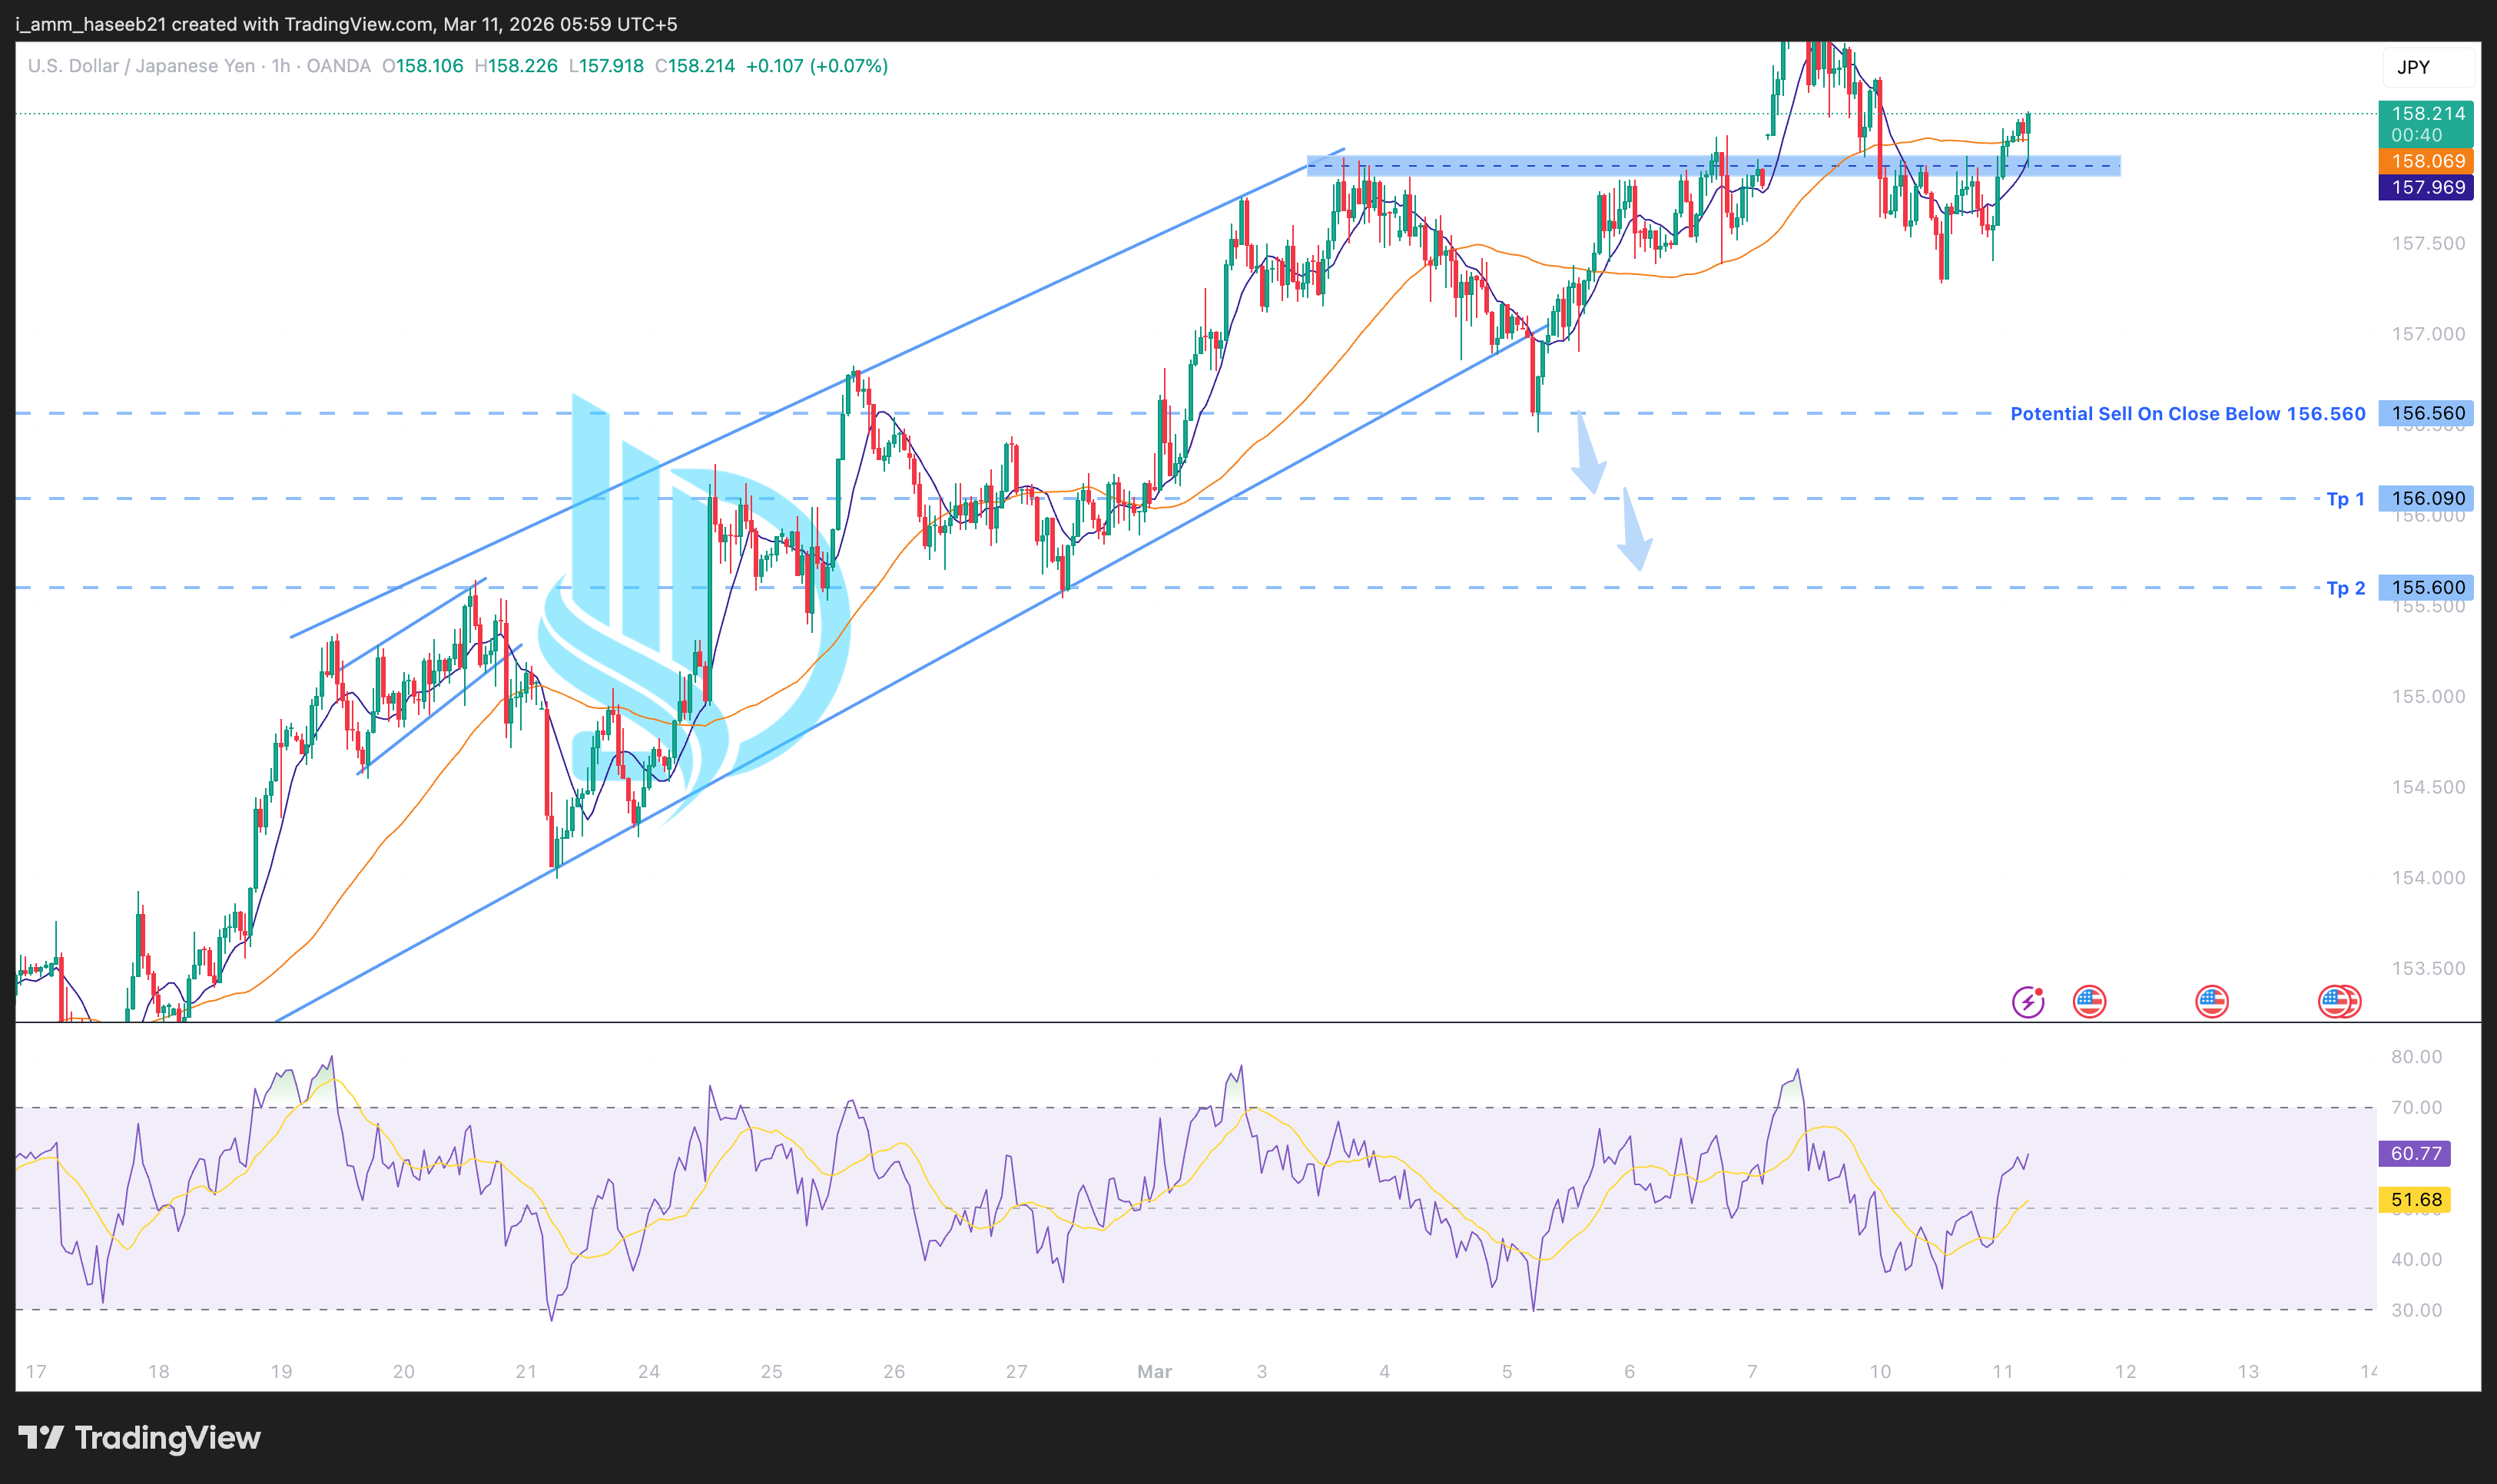
A confirmed 1H candle close below 156.560 would signal a structural breakdown and likely push price toward the next liquidity zones:
TP1 → 156.090 (first support / intraday demand level)
TP2 → 155.600 (major support and previous consolidation area)
Historically, when price breaks the lower boundary of a rising channel after a distribution phase, continuation toward the next demand zones occurs frequently due to trapped buyers exiting positions.
Technical observations:
Price breaking down from ascending channel structure
Lower highs forming after recent rejection near the channel top
Price moving below short-term moving averages
Bearish momentum increasing
RSI dropping toward the oversold region, showing strong downside pressure
A confirmed 1H candle close below 156.560 would signal a structural breakdown and likely push price toward the next liquidity zones:
TP1 → 156.090 (first support / intraday demand level)
TP2 → 155.600 (major support and previous consolidation area)
Historically, when price breaks the lower boundary of a rising channel after a distribution phase, continuation toward the next demand zones occurs frequently due to trapped buyers exiting positions.